 Back
Exploring Data with Tables and Graphs: Scatterplots, Correlation, and Regression
Study Guide - Smart Notes
 Tailored notes based on your materials, expanded with key definitions, examples, and context.
Scatterplots, Correlation, and Regression
Introduction to Paired Data Analysis
In statistics, analyzing paired data allows us to explore relationships between two quantitative variables. This is commonly done using graphical and numerical methods to determine if a correlation exists and to model the relationship with regression techniques.
Scatterplots
A scatterplot (or scatter diagram) is a graphical representation of paired quantitative data. Each point on the plot corresponds to one observation, with the horizontal axis (x-axis) representing the first variable and the vertical axis (y-axis) representing the second variable.
Purpose: To visually assess the relationship between two variables.
Interpretation: Patterns in the scatterplot can suggest the presence and type of correlation (linear, nonlinear, or none).
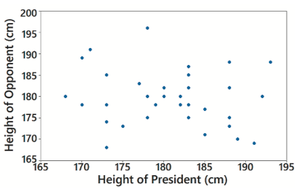
Example: A scatterplot of heights of presidents versus heights of their main opponents shows no clear pattern, indicating no correlation.
Correlation
Correlation measures the strength and direction of a relationship between two variables. When the values of one variable are associated with the values of another, a correlation exists.
Linear Correlation: Exists when the relationship between two variables can be approximated by a straight line.
No Correlation: If the scatterplot shows no discernible pattern, the variables are not correlated.
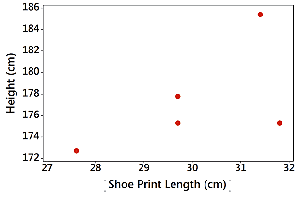
Example: The scatterplot of shoe print lengths and heights may suggest a possible correlation, but the pattern is not clear.
Linear Correlation Coefficient (r)
The linear correlation coefficient, denoted by r, quantifies the strength and direction of a linear relationship between two variables. The value of r ranges from -1 to 1:
r = 1: Perfect positive linear correlation
r = -1: Perfect negative linear correlation
r = 0: No linear correlation
Interpretation: The closer |r| is to 1, the stronger the linear relationship.
Formula for r:
Using r to Determine Correlation
To assess whether a linear correlation exists, compare the computed value of r to critical values from statistical tables (based on sample size and significance level). If |r| exceeds the critical value, the correlation is statistically significant.
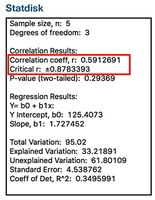
Example: For a sample size of 5, a computed r of 0.59 does not exceed the critical value of ±0.88, so the correlation is not statistically significant.
Regression (Introduction)
Linear regression involves finding the equation of the straight line that best fits the sample paired data. This line, called the regression line, can be used to predict values of one variable based on the other.
Regression Equation:
b0: y-intercept (value of y when x = 0)
b1: Slope (change in y for a one-unit increase in x)
Application: Regression is used in prediction, trend analysis, and understanding relationships between variables.
Summary Table: Correlation and Regression Concepts
Concept | Definition | Interpretation |
|---|---|---|
Scatterplot | Graph of paired (x, y) data | Visualizes relationship |
Correlation | Association between variables | Strength and direction |
Linear Correlation Coefficient (r) | Numerical measure of linear association | Ranges from -1 to 1 |
Regression | Best-fit line for prediction | Models relationship |
