 Back
Exploring Data with Tables and Graphs: Study Notes for Introductory Statistics
Study Guide - Smart Notes
 Tailored notes based on your materials, expanded with key definitions, examples, and context.
Exploring Data with Tables and Graphs
Frequency Distributions for Organizing and Summarizing Data
Frequency distributions are fundamental tools for organizing and summarizing data. They display how often each value or range of values occurs in a dataset, making it easier to identify patterns and trends.
Definition: A frequency distribution is a table that shows the number of occurrences for each category or interval of data.
Purpose: Helps to visualize the distribution and identify central tendencies, variability, and outliers.
Example: A frequency table of pulse rates for a group of individuals.
Histograms
Histograms are graphical representations of frequency distributions for quantitative data. They use bars to show the frequency of data within specified intervals.
Definition: A histogram is a bar graph where each bar represents the frequency of data within a particular interval.
Features: Bars touch each other, indicating continuous data; the shape reveals the distribution (e.g., symmetric, skewed).
Formula: For interval width:
Graphs that Enlighten: Dotplots
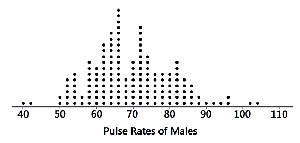
Dotplots are simple graphs for displaying quantitative data. Each data value is represented as a dot above a horizontal axis, and dots for equal values are stacked.
Definition: A dotplot is a graph where each dot represents a data value, stacked for repeated values.
Features: Shows the shape of the distribution and allows reconstruction of the original data values.
Example: Dotplot of pulse rates of males.
Graphs that Enlighten: Stemplots (Stem-and-Leaf Plots)
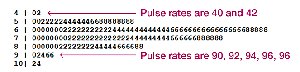
Stemplots, or stem-and-leaf plots, are used to display quantitative data by splitting each value into a 'stem' and a 'leaf.' This method retains the original data values and shows the distribution's shape.
Definition: A stemplot separates each value into a stem (e.g., tens digit) and a leaf (e.g., units digit).
Features: Retains original data, shows distribution, and sorts data.
Example: Stemplot of pulse rates.
Time-Series Graphs
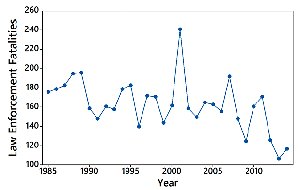
Time-series graphs display quantitative data collected at different points in time. They are useful for identifying trends, cycles, and patterns over time.
Definition: A time-series graph plots data values against time intervals.
Features: Reveals trends, fluctuations, and long-term changes.
Example: Law enforcement fatalities over years.
Bar Graphs
Bar graphs are used to display frequencies of categories for categorical (qualitative) data. Bars are of equal width and may be separated by gaps.
Definition: A bar graph uses bars to represent frequencies of different categories.
Features: Makes comparison between categories easier.
Example: Frequency of causes of fatal plane crashes.
Pareto Charts
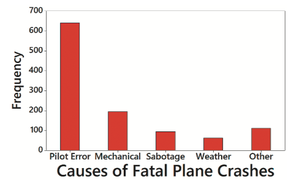
Pareto charts are specialized bar graphs for categorical data, with bars arranged in descending order of frequency. They highlight the most significant categories.
Definition: A Pareto chart is a bar graph with bars ordered from highest to lowest frequency.
Features: Emphasizes the most important categories.
Example: Pareto chart of causes of fatal plane crashes.
Pie Charts
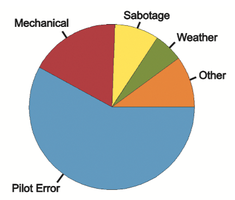
Pie charts represent categorical data as slices of a circle, with each slice proportional to the frequency of the category. They are commonly used for showing relative proportions.
Definition: A pie chart divides a circle into slices representing categories.
Features: Shows distribution in a visually intuitive format.
Example: Pie chart of causes of fatal plane crashes.
Graphs That Deceive: Nonzero Vertical Axis
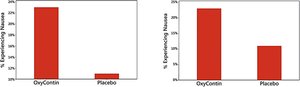
Some graphs can be misleading if the vertical axis does not start at zero, exaggerating differences between groups. Always check the axis scale to avoid misinterpretation.
Definition: A nonzero vertical axis starts at a value greater than zero, distorting visual differences.
Example: Bar graphs with different axis starting points.
Graphs That Deceive: Pictographs
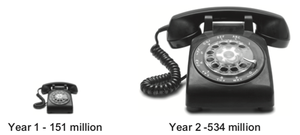
Pictographs use images to represent data, but can be misleading if the size of the image exaggerates differences. For example, doubling the sides of a square increases its area by four times, not two.
Definition: Pictographs use pictures to represent data values.
Features: Can distort differences due to geometric scaling.
Example: Pictograph of phone records collected.
Concluding Thoughts
There are many types of graphs available for data analysis, and new forms are continually being developed. The ability to create and interpret effective graphs is essential for understanding data and making informed decisions.
