Back

Exploring Data with Tables and Graphs: Histograms, Distribution Shapes, and Assessing Normality

Study Guide - Learn with Videos

Curated lessons matched to your uploaded material – learn every topic step by step.

Frequency Distributions

  • Guided course
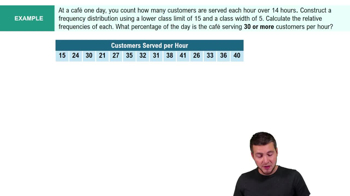
    Intro to Frequency Distributions Example 1
    06:19
  • Guided course
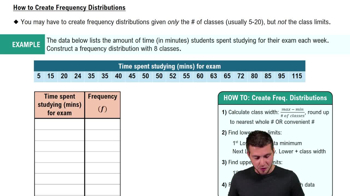
    How to Create Frequency Distributions
    06:29
  • Guided course
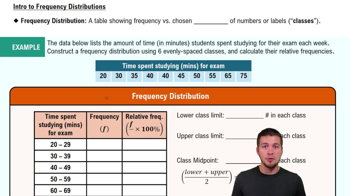
    Intro to Frequency Distributions
    06:38

Histograms

  • Guided course
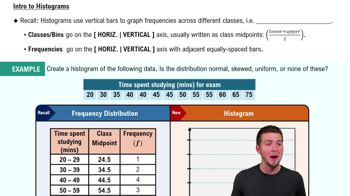
    Intro to Histograms
    05:54
  • Guided course
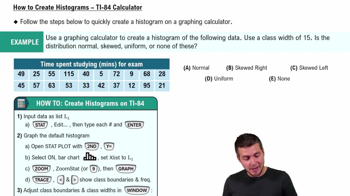
    How to Create Histogram - TI-84 Calculator
    07:10

Uniform Distribution

  • Guided course
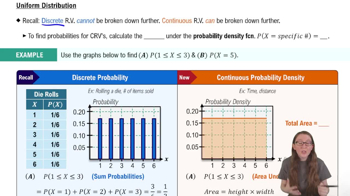
    Uniform Distribution
    06:06
  • Guided course
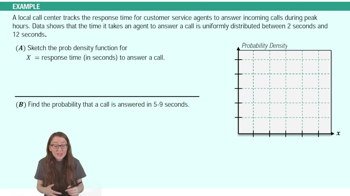
    Uniform Distribution Example 1
    02:50

Standard Normal Distribution

  • Guided course
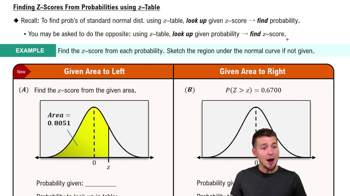
    Z-Scores from Probabilities
    08:50
  • Guided course
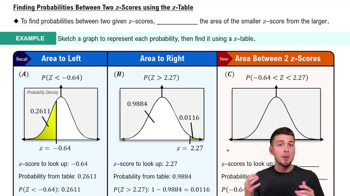
    Probabilities Between Two Values
    03:50
  • Guided course
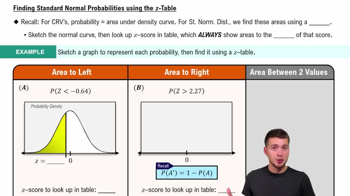
    Finding Standard Normal Probabilities using z-Table
    09:47

Interpreting Standard Deviation

  • Guided course
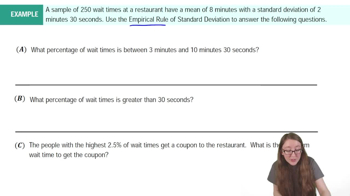
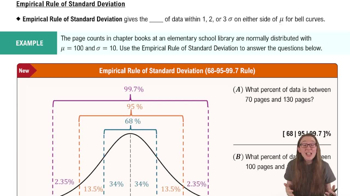
    Empirical Rule of Standard Deviation and Range Rule of Thumb Example 1
    05:42
  • Guided course
    Empirical Rule of Standard Deviation and Range Rule of Thumb Example 2
    01:56
  • Guided course
    Empirical Rule of Standard Deviation and Range Rule of Thumb
    07:10

Scatterplots & Intro to Correlation

  • Guided course
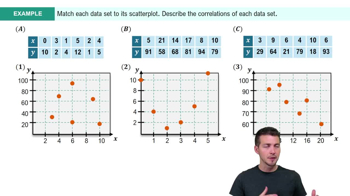
    Scatterplots & Intro to Correlation Example 1
    05:14
  • Guided course
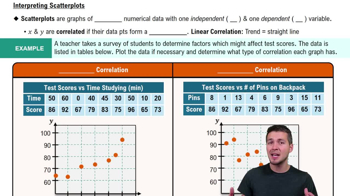
    Scatterplots & Intro to Correlation
    06:36
  • Guided course
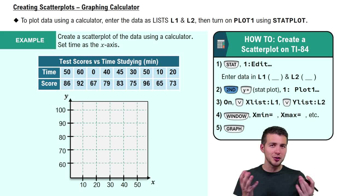
    Creating Scatterplots - Graphing Calculator
    05:26