 Back
BackFoundations and Exploratory Concepts in College Statistics
Study Guide - Smart Notes
 Tailored notes based on your materials, expanded with key definitions, examples, and context.
Statistical Thinking
Overview of Statistical Processes
Statistical thinking involves understanding how data is collected, analyzed, and interpreted to draw meaningful conclusions. The process typically follows a structured approach:
Purpose: Define the goal of the statistical study.
Prepare: Consider what the data means, the context, and how it was collected.
Analyze: Explore and summarize the data using statistical methods.
Conclude: Draw conclusions based on the analysis.
Key Concepts
Population vs. Sample:
Population: The entire collection of data or subjects of interest.
Sample: A subset of the population used for analysis.
Observations: Individual data points collected in a study.
Measurements: Quantitative or qualitative values assigned to observations.
Sampling
Representativeness and Methods
Sampling is the process of selecting a subset of the population to make inferences about the whole. A representative sample closely resembles the population in relevant characteristics.
Random Sampling: Every member of the population has an equal chance of being selected.
Convenience Sampling: Choosing individuals who are easiest to reach.
Stratified Sampling: Dividing the population into subgroups and sampling from each.
Cluster Sampling: Dividing the population into clusters and randomly selecting clusters.
Exploring Data: Tables and Graphs
Frequency Distributions
Frequency distributions summarize data by showing how often each value or category occurs. They are foundational for exploratory data analysis (EDA).
Defining Categories:
Natural categories (e.g., gender, age groups).
Constructed categories (e.g., score ranges).
Class Limits:
Lower and upper boundaries for each category.
Class width/bin size: Difference between upper and lower class limits.
Class midpoint: Average of upper and lower class limits.
Histograms
A histogram is a bar graph that displays the frequency of data within specified intervals (bins).
Relative Frequency: Shows the proportion of data in each bin compared to the total.
Cumulative Frequency: Sum of frequencies up to a certain bin.
Scatterplots
Scatterplots are graphs that display paired data points on a coordinate plane, useful for visualizing relationships between two variables.
Each point: Represents one observation with values for two variables.
Types of Relationships: Positive, negative, or no correlation.
Describing, Exploring, and Comparing Data
Measures of Center
Measures of center describe the typical or central value in a dataset.
Mean: The arithmetic average, calculated as .
Median: The middle value when data is ordered.
Mode: The value that occurs most frequently.
Measures of Variation
Measures of variation quantify the spread or dispersion of data values.
Range: Difference between the maximum and minimum values.
Interquartile Range (IQR):
Variance: Average squared deviation from the mean.
Sample variance:
Standard Deviation: Square root of variance.
Sample standard deviation:
Coefficient of Variation: Relative measure of dispersion, calculated as
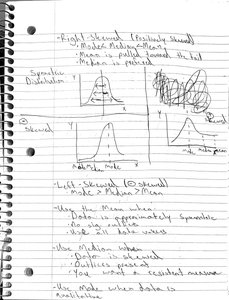
Skewness
Skewness describes the asymmetry of a distribution.
Right-skewed (positively skewed): Mean > Median > Mode
Left-skewed (negatively skewed): Mode > Median > Mean
Symmetric: Mean ≈ Median ≈ Mode
Correlation and Regression
Correlation
Correlation measures the strength and direction of a linear relationship between two variables.
Pearson Product-Moment Correlation:
Formula:
Types of Correlation:
Perfect positive (r = +1)
Perfect negative (r = -1)
No linear correlation (r = 0)
Regression
Regression analysis estimates the relationship between variables, often to predict one variable based on another.
Linear Regression: Fits a straight line to data points.
Equation:
Coefficient of Determination (R2): Measures the proportion of variance in y explained by x.
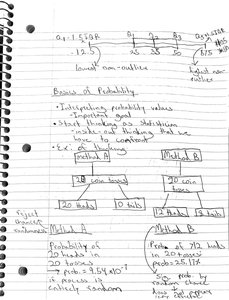
Probability
Basics of Probability
Probability quantifies the likelihood of events occurring. It is foundational for inferential statistics.
Probability Formula:
Simple Events: Outcomes that cannot be broken down further.
Compound Events: Outcomes composed of two or more simple events.
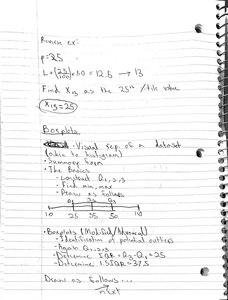
Percentiles and Z-Scores
Percentiles
Percentiles indicate the position of a data value within a dataset.
Percentile Formula:
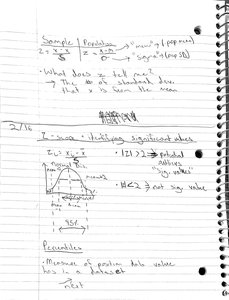
Z-Scores
Z-scores measure how many standard deviations a data value is from the mean.
Z-Score Formula:
Used to identify outliers and compare values across distributions.
Data Types and Classification
Quantitative vs. Categorical Data
Data can be classified as quantitative (numerical) or categorical (qualitative).
Quantitative:
Discrete: Countable values (e.g., number of students).
Continuous: Measurable values (e.g., height, weight).
Categorical:
Nominal: Categories without order (e.g., colors).
Ordinal: Categories with order (e.g., rankings).
Boxplots
Visualizing Data Distribution
Boxplots provide a visual summary of data, showing the median, quartiles, and potential outliers.
Components:
Minimum, Q1, Median, Q3, Maximum
Outliers: Values outside 1.5 IQR from quartiles
Summary Table: Data Types
Type | Description | Examples |
|---|---|---|
Quantitative (Discrete) | Countable values | Number of books |
Quantitative (Continuous) | Measurable values | Height, weight |
Categorical (Nominal) | No order | Colors, gender |
Categorical (Ordinal) | Ordered categories | Rankings, grades |
Summary Table: Measures of Center
Measure | Definition | Properties |
|---|---|---|
Mean | Arithmetic average | Influenced by outliers |
Median | Middle value | Resistant to outliers |
Mode | Most frequent value | May not exist or may not be unique |
Summary Table: Measures of Variation
Measure | Definition | Properties |
|---|---|---|
Range | Max - Min | Simple, sensitive to outliers |
Variance | Average squared deviation | Units squared |
Standard Deviation | Square root of variance | Same units as data |
IQR | Q3 - Q1 | Resistant to outliers |
