 Back
BackFoundations of Introductory Statistics: Populations, Samples, Data, and Probability
Study Guide - Smart Notes
 Tailored notes based on your materials, expanded with key definitions, examples, and context.
Introduction to Statistics and Collecting Data
Populations and Samples
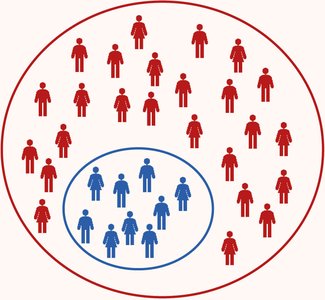
Statistics is the science of collecting, analyzing, interpreting, and presenting data. A fundamental concept in statistics is the distinction between a population and a sample.
Population: The entire group of individuals or items that we want to study or draw conclusions about.
Sample: A subset of the population, selected for actual analysis. Samples are used because studying an entire population is often impractical or impossible.
Sampling: The process of selecting a sample from the population.
Inference: Drawing conclusions about a population based on information from a sample.
Example: If we want to know the average height of all college students in a country (population), we might measure the heights of 100 students from several universities (sample).
Describing Data with Tables and Graphs
Bar Graphs
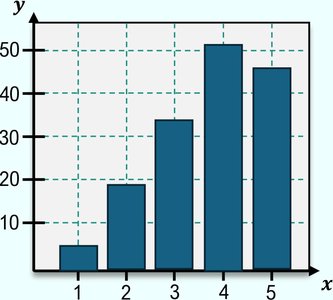
Bar graphs are a common way to visually represent categorical or discrete data. Each bar represents a category, and the height of the bar corresponds to the frequency or value for that category.
Key Features: Bars can be vertical or horizontal; the length or height of the bar is proportional to the value it represents.
Use: Useful for comparing quantities across different categories.
Example: A bar graph showing the number of students in different grade categories.
Probability
Basic Probability Concepts
Probability is the branch of mathematics that deals with quantifying the likelihood of events. It is foundational for inferential statistics.
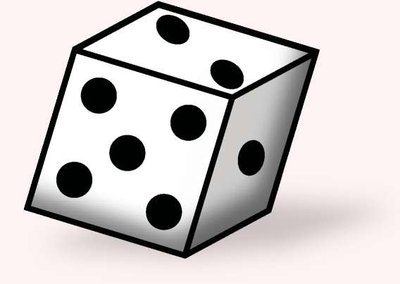
Experiment: A process that leads to an outcome (e.g., rolling a die).
Sample Space (S): The set of all possible outcomes of an experiment.
Event: A subset of the sample space; one or more outcomes.
Probability of an Event (A): The likelihood that event A occurs, denoted as P(A).
Formula: For equally likely outcomes,
Example: The probability of rolling a 4 on a fair six-sided die is .
Random Experiments and Multiple Outcomes
When more than one random experiment is performed, the sample space expands to include all possible combinations of outcomes.
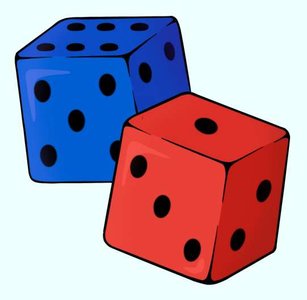
Example: Rolling two dice (one red, one blue) results in 36 possible outcomes (6 for each die).

Random Sampling
Random sampling is a method of selecting a sample from a population such that every member has an equal chance of being chosen. This is crucial for ensuring that the sample is representative of the population and for making valid inferences.
Example: Drawing names from a hat or using a random number generator to select survey participants.
Describing Data Numerically
Frequency and Counting
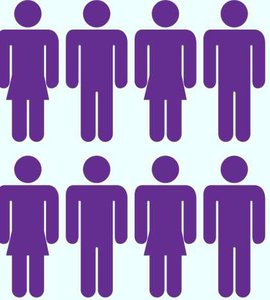
Counting the number of individuals in different categories is a basic descriptive statistic. This can be represented visually or in tables.
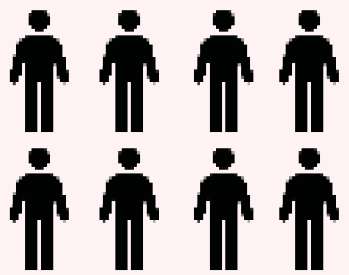
Example: Counting the number of males and females in a sample.
Additional Visual Representations in Statistics
Survey and Data Collection Tools
Surveys and checklists are common tools for collecting data in statistics. They help organize responses and ensure systematic data collection.
Example: A checklist used to record survey responses.
Summary Table: Key Statistical Concepts
Concept | Definition | Example |
|---|---|---|
Population | Entire group of interest | All college students in a country |
Sample | Subset of the population | 100 students from several universities |
Random Sampling | Each member has equal chance of selection | Drawing names from a hat |
Probability | Likelihood of an event | Rolling a 4 on a die: 1/6 |
Bar Graph | Visual representation of categorical data | Number of students by grade |
