 Back
BackFoundations of Statistical Studies: Controlled Experiments and Observational Studies
Study Guide - Smart Notes
 Tailored notes based on your materials, expanded with key definitions, examples, and context.
Controlled Experiments
Introduction to Controlled Experiments
Controlled experiments are a cornerstone of statistical methodology, designed to determine the effect of a treatment or intervention by comparing outcomes between a treatment group and a control group. The goal is to minimize bias and confounding factors, ensuring that observed differences are attributable to the treatment itself.
Treatment Group: Receives the intervention or treatment being studied.
Control Group: Does not receive the treatment, serving as a baseline for comparison.
Randomization: Subjects are randomly assigned to groups to reduce selection bias and confounding.
The Salk Vaccine Field Trial
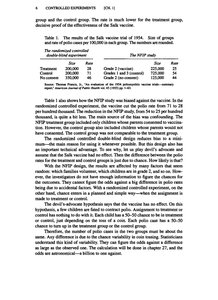
This landmark study tested the effectiveness of the polio vaccine in the 1950s. Children were randomly assigned to receive the vaccine or serve as controls. The study's design allowed for a clear comparison of polio incidence between groups, demonstrating the vaccine's efficacy.
Randomized Controlled Trial (RCT): Considered the gold standard for evaluating treatment effects.
Bias and Confounding: Non-randomized designs can introduce bias, as seen in alternative study designs where assignment was not random.
Group | Number of Cases | Rate per 100,000 |
|---|---|---|
Treatment | 33 | 28 |
Control | 115 | 71 |
Example: The Salk vaccine trial showed a much lower rate of polio in the vaccinated group compared to the control group, supporting the vaccine's effectiveness.
Other Examples: The Portacaval Shunt
Controlled experiments are also used in medical research to assess surgical procedures. For example, studies on the portacaval shunt for liver disease compared outcomes between patients who received the surgery and those who did not, using randomization to ensure comparability.
Group | Number of Patients | Mortality Rate (%) |
|---|---|---|
Surgery | 15 | 40 |
Control | 15 | 60 |
Example: The randomized design allowed for a fair assessment of the surgery's impact on mortality.
Historical Controls
Sometimes, studies use historical controls—comparing current patients receiving a new treatment to past patients who did not. This design is more prone to bias, as differences in patient populations or other factors over time can confound results.
Randomized vs. Historical Controls: Randomized controls provide stronger evidence due to reduced confounding.
Group | Number of Patients | Mortality Rate (%) |
|---|---|---|
Randomized Surgery | 20 | 30 |
Historical Surgery | 20 | 35 |
Example: The difference in mortality rates may be due to factors other than the treatment itself when using historical controls.
Summary of Controlled Experiments
Comparison between treatment and control groups is essential for evaluating interventions.
Randomization is key to minimizing bias and confounding.
Placebos are often used in control groups to account for psychological effects.
Blinding (single or double) helps prevent bias in outcome assessment.
Observational Studies
Introduction to Observational Studies
Observational studies differ from controlled experiments in that the investigator does not assign treatments but observes existing differences among groups. These studies are common in situations where controlled experiments are impractical or unethical.
Association vs. Causation: Observational studies can identify associations but cannot definitively establish causality due to potential confounding factors.
Confounding: A major challenge, as differences between groups may be due to factors other than the variable of interest.
Examples of Observational Studies
Smoking and Lung Cancer: Early studies observed higher lung cancer rates among smokers, but confounding factors (e.g., age, occupation) had to be considered.
Drug Trials: Some drug studies use observational designs when randomization is not possible, comparing outcomes between those who choose to take a drug and those who do not.
Case Study: Sex Bias in Graduate Admissions
Analysis of graduate admissions data can reveal apparent biases. However, confounding variables, such as differences in application rates to various departments, can explain observed disparities.
Major | Men Applied | Men Admitted (%) | Women Applied | Women Admitted (%) |
|---|---|---|---|---|
A | 825 | 62 | 108 | 82 |
B | 560 | 63 | 25 | 68 |
C | 325 | 37 | 593 | 34 |
D | 417 | 33 | 375 | 35 |
E | 191 | 28 | 393 | 24 |
F | 373 | 6 | 341 | 7 |
Example: The overall admission rate for men was higher, but when analyzed by department, the difference was much smaller or even reversed, illustrating Simpson's paradox.
Confounding in Observational Studies
Confounding occurs when an outside variable influences both the independent and dependent variables, leading to a spurious association. Proper statistical analysis and study design aim to identify and adjust for confounders.
Definition: A confounder is a variable that is associated with both the exposure and the outcome.
Example: In studies of smoking and lung cancer, age may be a confounder if older individuals are both more likely to smoke and more likely to develop cancer.
Summary of Observational Studies
Useful when controlled experiments are not feasible.
Can identify associations but are limited in establishing causality.
Confounding and bias are major concerns; statistical methods can help adjust for these factors.
Key Terms and Concepts
Randomization: Assigning subjects to groups by chance to reduce bias.
Control Group: The group that does not receive the treatment, used as a baseline.
Placebo: An inactive treatment given to control groups to mimic the experience of the treatment group.
Blinding: Keeping subjects and/or investigators unaware of group assignments to prevent bias.
Confounding: The mixing of effects between the treatment and other variables.
Simpson's Paradox: A trend that appears in different groups of data but disappears or reverses when the groups are combined.
