 Back
BackFoundations of Statistics: Data, Variables, Measurement, and Central Tendency
Study Guide - Smart Notes
 Tailored notes based on your materials, expanded with key definitions, examples, and context.
Introduction to Statistics and Collecting Data
Overview of Quantitative Research
Quantitative research utilizes numerical data to efficiently communicate information, model real-world phenomena, and apply established statistical theory and practice. - Efficiency: Numbers allow for concise communication and summarization of complex information. - Approximation/Modelling: Quantitative models represent phenomena, enabling predictions and analysis. - Powerful Language: Statistical techniques are grounded in established theory, facilitating rigorous analysis. 
Basic Concepts: Variables and Constants
In statistics, understanding the distinction between variables and constants is fundamental. - Variable: Any characteristic, property, or phenomenon that can differ among individuals or objects (e.g., height, age, test scores). - Constant: An aspect that does not vary within the sample under study.
Population vs. Sample
Statistical studies often distinguish between populations and samples. - Population: The entire set of individuals or objects of interest in a study. - Parameter: A numerical value describing a population, derived from measurements of all individuals. - Sample: A subset of the population, selected to represent the population. - Statistic: A numerical value describing a sample, derived from measurements of sampled individuals. 

Symbols in Statistics
- Mu (μ): Symbol for population mean.  - Lower case sigma (σ): Symbol for population standard deviation.
  - X-Bar (̅X): Symbol for sample mean.
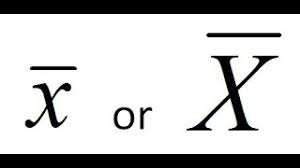
Describing Data with Tables and Graphs
Frequency Distribution
Frequency distributions summarize how often each value occurs in a dataset. - Frequency: The number of times a score appears in a dataset. - Frequency Distribution: A table or graph showing scores and their frequencies. 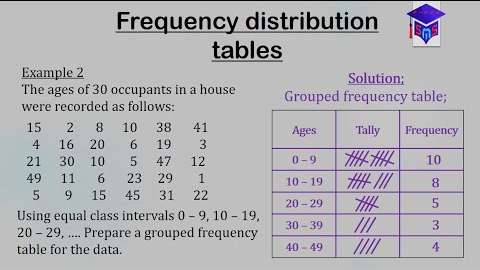
Bar Charts
Bar charts visually represent the frequency of categories in nominal or discrete data. - Each bar reflects the frequency of a category. 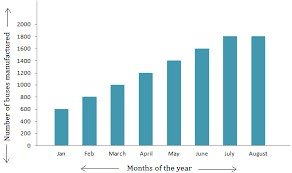
Histograms
Histograms display the distribution of continuous numerical data, using bars to represent frequencies within class intervals. 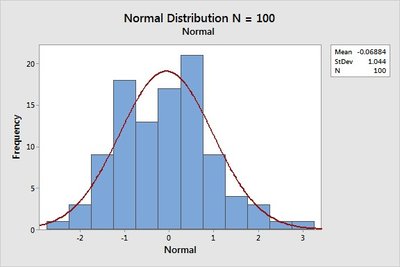
Describing Data Numerically
Types of Variables
Variables in quantitative research can be classified as follows: - Discrete: Limited number of values (e.g., number of siblings). - Categorical: Groups or categories (e.g., blood type, movie genre). - Continuous: Can take any value within a range (e.g., height, time).
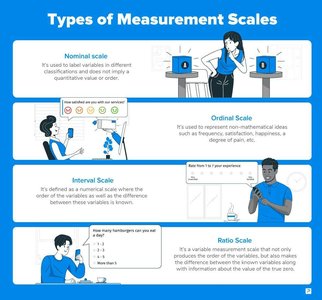
Levels of Measurement
Measurement levels determine how variables are categorized and analyzed: - Nominal: Categories without order or numerical value (e.g., gender, ethnicity). - Ordinal: Ordered categories with unequal intervals (e.g., rankings, Likert scales). - Interval: Ordered categories with equal intervals, no true zero (e.g., temperature in Celsius). - Ratio: Ordered categories with equal intervals and a true zero (e.g., height, weight). 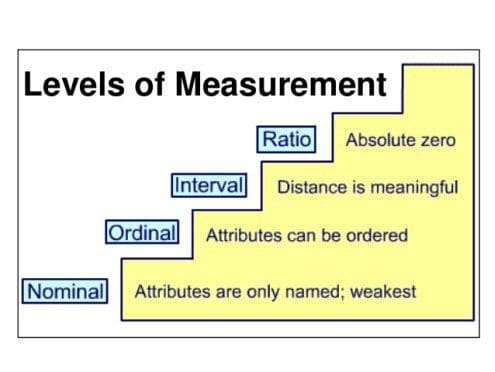
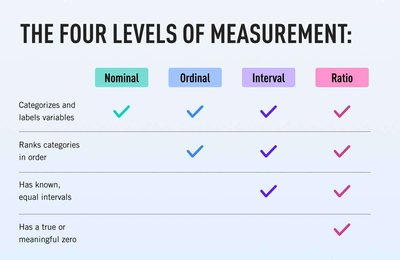
Level | Order | Equal Intervals | True Zero | Examples |
|---|---|---|---|---|
Nominal | No | No | No | Gender, Ethnicity |
Ordinal | Yes | No | No | Rankings, Socioeconomic Status |
Interval | Yes | Yes | No | Temperature (Celsius), IQ Scores |
Ratio | Yes | Yes | Yes | Height, Weight, Income |
Describing Data Numerically: Central Tendency
Measures of Central Tendency
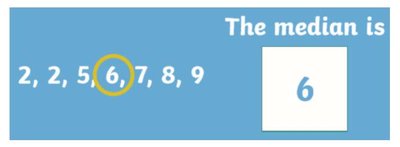
Central tendency describes the center of a dataset. - Mode: Most frequently occurring value. 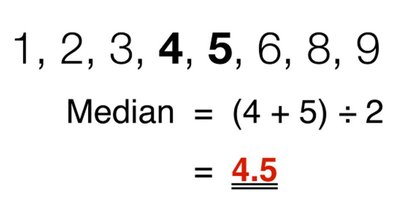 - Median: Middle value when data is ordered. For odd numbers, it is the middle value; for even numbers, it is the average of the two middle values.
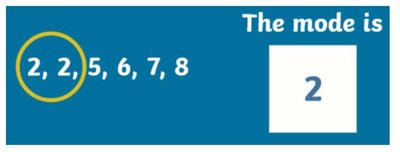
 - Mean: The average value, calculated as the sum of all values divided by the number of values.
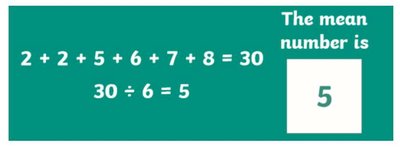
Formulas for Mean
- Sample Mean: where is the sample mean, is the sum of all sample values, and is the sample size. - Population Mean: where is the population mean, is the sum of all population values, and is the population size.
Summary Table: Population vs. Sample
Term | Definition | Example |
|---|---|---|
Population | Entire set of individuals of interest | All students at a university |
Parameter | Numerical value describing a population | 50% of students are late |
Sample | Subset of the population | Second year students at UKZN |
Statistic | Numerical value describing a sample | Average grade of sampled students |
Additional info:
- The notes cover foundational concepts from chapters 1-3 of a statistics course: Introduction to Statistics, Describing Data with Tables and Graphs, and Describing Data Numerically. - Examples and activities are provided to reinforce understanding of variable types, levels of measurement, and measures of central tendency. - Students should be able to define, differentiate, and provide their own examples for each concept.
