 Back
BackFrequency Tables and Data Binning: Study Notes for Statistics Students
Study Guide - Smart Notes
 Tailored notes based on your materials, expanded with key definitions, examples, and context.
Frequency Tables
Definition and Purpose
A frequency table is a structured method for organizing raw data into categories, showing how often each category occurs. This makes it easier to interpret and analyze data, especially when dealing with large datasets or categorical variables.
Categories (or classes): The distinct values or groups into which data are sorted.
Frequency: The number of times each category appears in the dataset.
Example: A teacher records grades for 25 students. The raw data is difficult to interpret, so a frequency table is constructed to summarize the counts for each grade.
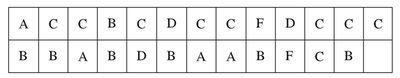
Additional info: The image above shows a raw data table of grades, which can be converted into a frequency table for easier analysis.
Constructing a Frequency Table
To create a frequency table:
List all possible categories (e.g., grades A, B, C, D, F).
Count the number of occurrences for each category.
Record the frequencies in a table.
Example: Taste test ratings for a new beverage are collected on a 5-point scale. The frequency table summarizes how many people gave each rating.
Relative Frequency Tables
Definition and Calculation
A relative frequency table shows the proportion or percentage of data values in each category, providing a normalized view of the data.
Relative frequency:
Cumulative frequency: The sum of frequencies for a category and all preceding categories.
Example: For the taste test data, a table can be constructed with columns for frequency, relative frequency, and cumulative frequency.
Interpreting Relative and Cumulative Frequencies
Relative frequency: Useful for comparing categories when sample sizes differ.
Cumulative frequency: Helps understand how data accumulates across categories.
Example Questions:
What percentage of respondents gave the highest rating?
What percentage gave one of the three lowest ratings?
Binning Data
Definition and Application
When dealing with quantitative data with many possible values, it is useful to group (or bin) the data into categories covering a range of values. Each bin represents a range of possible values for a class.
Bin: A range of values used as a category for quantitative data.
Binning: The process of grouping data into bins.
Example: Exam scores for 20 students are grouped into bins (e.g., 70–79, 80–89, 90–99) and summarized in a frequency table with columns for relative and cumulative frequency.
Application: Keyboard Configuration Ratings
Comparing Qwerty and Dvorak Keyboards
Keyboard efficiency can be measured by assigning point values to each letter based on its row position. The sum of these values for each word provides a rating for typing ease.
Qwerty keyboard: Higher ratings indicate more effort required.
Dvorak keyboard: Lower ratings indicate easier typing.
Example: Ratings for the words in the Preamble to the U.S. Constitution are binned and summarized in frequency tables for both keyboard configurations.
Constructing Frequency Tables for Binned Data
For both Qwerty and Dvorak ratings, use bins such as 0–2, 3–5, 6–8, 9–11, and 12–14. Calculate the frequency and relative frequency for each bin.
Relative frequency (percentage):
Interpretation: Comparing the tables shows which keyboard arrangement is easier for typing the Preamble, based on the distribution of ratings.
Summary Table: Frequency Table Structure
Category/Bin | Frequency | Relative Frequency | Cumulative Frequency |
|---|---|---|---|
Example: Grade A | Number of A's | Proportion of A's | Sum up to A |
Example: Bin 70–79 | Number of scores in bin | Proportion in bin | Sum up to bin |
... | ... | ... | ... |
Additional info: This table format is used for both categorical and binned quantitative data.
