Back
Fundamental Concepts and Graphical Methods in Statistics: Practice Final Test Study Guide
Study Guide - Learn with Videos
 Curated lessons matched to your uploaded material – learn every topic step by step.
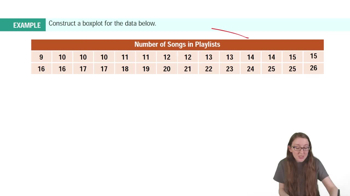
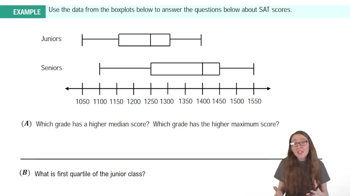
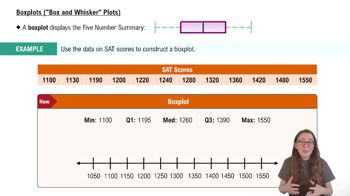
Boxplots
- Guided course
 01:52

- Guided course 02:48
- Guided course 03:54
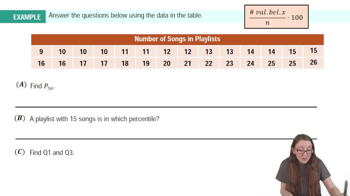
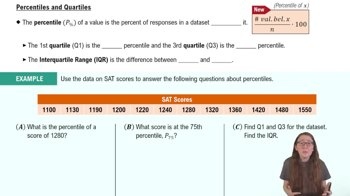
Percentiles & Quartiles
- Guided course 04:30
- Guided course 07:11
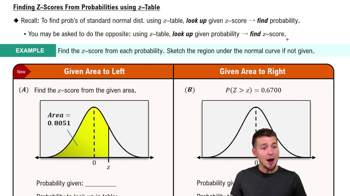
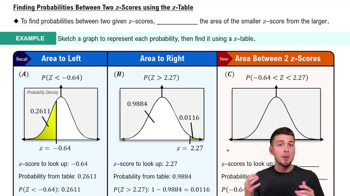
Standard Normal Distribution
- Guided course 08:50
- Guided course 03:50
- Guided course 09:47
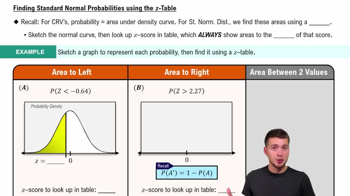
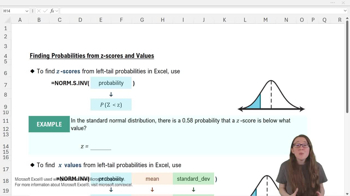
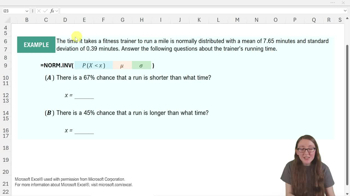
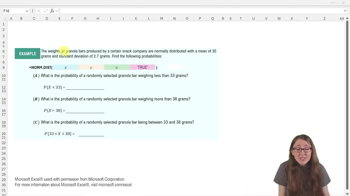
Finding Probabilities, Z Values, and X Values with the Normal Distribution-Excel
- Guided course 08:09
- Guided course 03:05
- Guided course 05:07
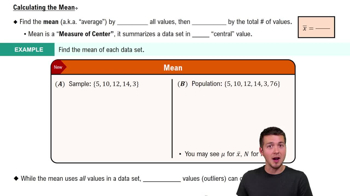
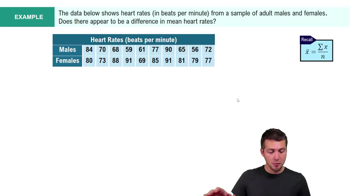
Mean
- Guided course 04:52
- Guided course 03:08
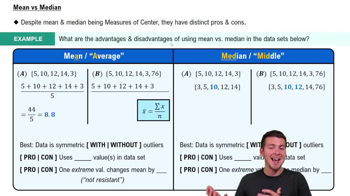
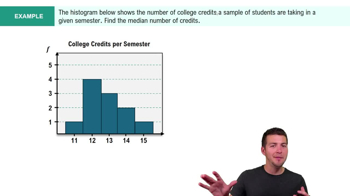
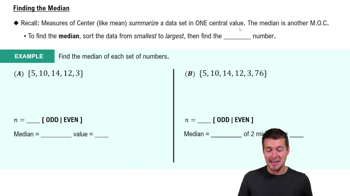
Median
- Guided course 04:48
- Guided course 02:35
- Guided course 03:26
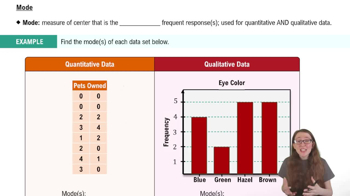
Mode
- Guided course 03:20