 Back
Fundamental Sampling Distributions and Their Applications in Introductory Statistics
Study Guide - Smart Notes
 Tailored notes based on your materials, expanded with key definitions, examples, and context.
Sampling Distributions
Random Sampling Definitions
Sampling is a fundamental concept in statistics, allowing us to make inferences about populations based on subsets called samples. A population is the entire set of observations of interest, while a sample is a subset of the population. A random sample consists of n independent random variables, each with the same probability distribution.
Population: The complete collection of data points or measurements.
Sample: A subset of the population, selected for analysis.
Random Sample: n independent random variables, each identically distributed.
Sample Statistics
Sample statistics are used to estimate population parameters. The most common sample statistics are the sample mean, sample variance, and sample standard deviation.
Sample Mean:
Sample Variance:
Sample Standard Deviation:
Central Limit Theorem (CLT)
Concept and Illustration
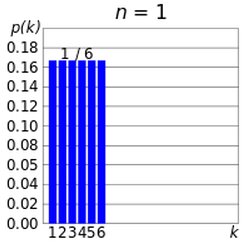
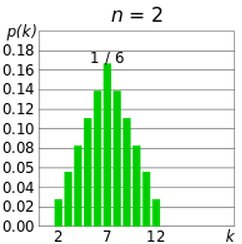
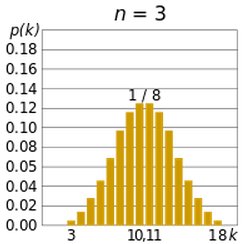
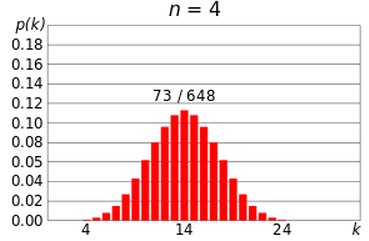
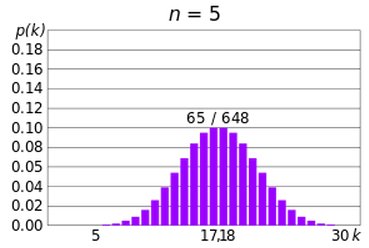
The Central Limit Theorem states that, for a sufficiently large sample size (n ≥ 30), the sampling distribution of the sample mean approaches a normal distribution, regardless of the population's original distribution. This is illustrated by rolling dice: as the number of dice increases, the distribution of their sums becomes bell-shaped.
CLT Statement: If is the mean of a random sample of size n from a population with mean and variance , then approaches the standard normal distribution as .
Normal Approximation: For n ≥ 30, the normal approximation is satisfactory.
Example: Dice throws demonstrate the CLT. With one die, the distribution is uniform; with more dice, the sum's distribution becomes increasingly normal.
Applications of CLT
Sample Mean Probability: Used to calculate probabilities for sample means from normal populations.
Example: If a machine fills cans with a mean of 12.1 fl oz and standard deviation 0.05 fl oz, the probability that the sample mean of 10 cans is less than 12.0 fl oz can be calculated using the CLT.
Sampling Distribution of the Difference Between Two Means
Comparing Two Populations
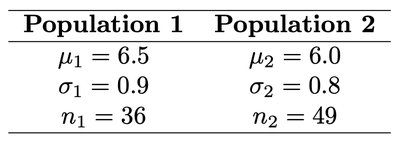
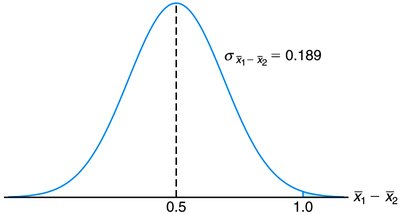
To compare two populations, we analyze the sampling distribution of the difference between their means. If independent samples of sizes n1 and n2 are drawn from populations with means and and variances and , the difference is approximately normally distributed.
Mean:
Variance:
Z-score:
Example: Comparing lifetimes of light bulbs from two manufacturers.
Student-t Distribution
Definition and Usage
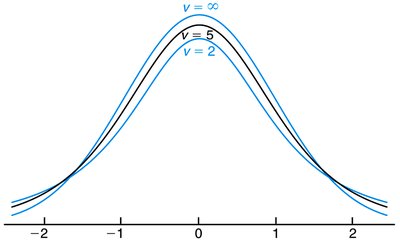
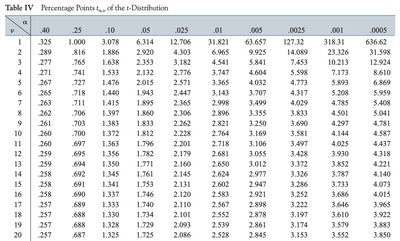
The Student-t distribution is used when the population standard deviation is unknown and must be estimated from the sample, or when the sample size is small (n < 30). As sample size increases, the t-distribution converges to the normal distribution.
Probability Density Function:
Degrees of Freedom: v = n - 1
Test Statistic:
Example: For a sample of n = 15, the probability for a test statistic t0 = 2.8 can be found using the t-distribution table.
Chi-Squared Distribution
Definition and Application
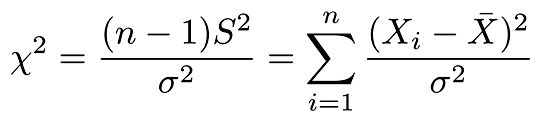
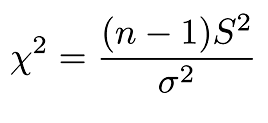
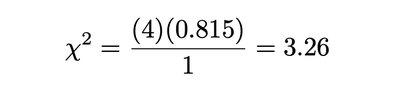
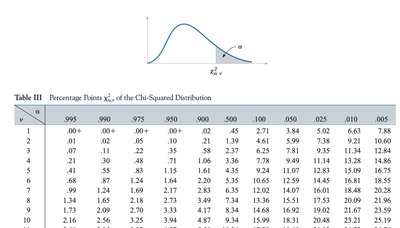
The chi-squared distribution is used to analyze sample variances. If S2 is the variance of a random sample of size n from a normal population with variance , then the statistic has a chi-squared distribution with v = n - 1 degrees of freedom.
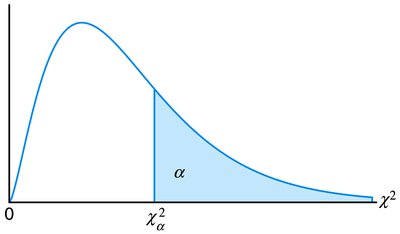
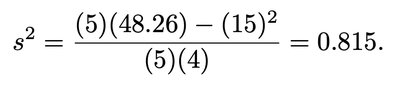
Example: Testing the standard deviation of car battery lifespans using a sample of five batteries.
F-Distribution
Definition and Application
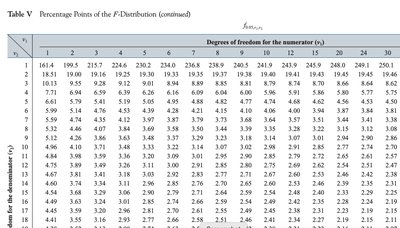
The F-distribution is used to compare variances between two populations or samples. It has two parameters: degrees of freedom for the numerator and denominator. If S12 and S22 are variances of independent samples of sizes n1 and n2 from populations with variances and , then has an F-distribution.
Equal Variances: If , then
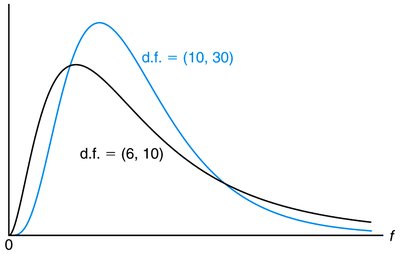
Example: Comparing heat producing capacity of coal from two mines using the F-test.
Summary Table: Sampling Distributions
Distribution | Use | Key Parameters |
|---|---|---|
Normal | Means, n ≥ 30, population variance known | n |
t-distribution | Means, n < 30, population variance unknown | n-1 (degrees of freedom) |
Chi-squared | One sample variance | n-1 (degrees of freedom) |
F-distribution | Two sample variances | v1, v2 (degrees of freedom) |
Additional info: The notes cover the essential sampling distributions used in inferential statistics, including their formulas, applications, and examples. Images included directly illustrate the mathematical concepts and probability distributions discussed.
