 Back
BackFundamentals of Statistics: Key Concepts and Methods
Study Guide - Smart Notes
 Tailored notes based on your materials, expanded with key definitions, examples, and context.
Fundamentals of Statistics
The Five Basic Words of Statistics
Understanding statistics begins with mastering its core vocabulary. These five terms are foundational for all statistical analysis:
Population: All members of a group about which you want to draw a conclusion. Examples: All registered voters in a country, all patients treated at a hospital in a year.
Sample: A subset of the population selected for analysis. Examples: 100 voters surveyed from a city, a group of patients filling out a questionnaire.
Parameter: A numerical measure describing a characteristic of a population. Examples: The average age of all voters, the percentage of all patients satisfied with care.
Statistic: A numerical measure describing a characteristic of a sample. Examples: The average age in a sample of voters, the satisfaction rate in a sample of patients. Interpretation: Most statistical analysis is performed on samples, as collecting data from an entire population is often impractical.
Variable: A characteristic of an item or individual to be analyzed. Examples: Gender, income, book category, number of cereal varieties. Interpretation: Variables are the focus of analysis; each observation is a set of variable values for one individual or item.
Types of Variables:
Categorical Variables: Values are selected from a set list of categories. Examples: Gender (male/female), academic major (Math, Science, etc.).
Numerical Variables: Values are counts or measurements. Subtypes:
Discrete: Countable values (e.g., number of elections voted in).
Continuous: Measurable values that can take any value within a range (e.g., household income).
Operational Definition: Every variable should have a clear, universally accepted definition to avoid confusion in analysis.
The Branches of Statistics
Statistics is divided into two main branches:
Descriptive Statistics: Focuses on collecting, summarizing, and presenting data. Examples: Average age of voters, variation in product weights. Interpretation: Descriptive statistics are commonly used in everyday life and form the basis for further analysis.
Inferential Statistics: Uses sample data to draw conclusions about a population. Examples: Using survey results to estimate the percentage of all workers planning to retire late. Interpretation: Inferential statistics involve hypothesis testing and require careful application to avoid errors.
Sources of Data
Data for statistical analysis can come from several sources:
Published Sources: Data available in print or electronic form, such as government reports or online databases. Interpretation: Always consider the potential bias and completeness of published data.
Experiments: Studies where variables are manipulated to observe effects, typically involving treatment and control groups. Example: Clinical trials for new drugs. Interpretation: Experiments can be single-blind or double-blind to reduce bias; the placebo effect must also be considered.
Surveys: Collect data through questionnaires or interviews. Examples: Census forms, opinion polls. Interpretation: Surveys can be informal, targeted, or random, affecting how results are interpreted.
Sampling Concepts
Sampling is the process of selecting members from a population for analysis. The method of sampling affects the validity of conclusions drawn.
Probability Sampling: Each item has a known chance of selection, making the sample more representative. Interpretation: Allows for inferential statistics; nonprobability sampling is used for rough estimates or pilot studies.
Simple Random Sampling: Every individual/item has an equal chance of selection. Examples: Drawing cards from a deck, using random number tables. Interpretation: Forms the basis for other random sampling techniques.
Frame: The list of all items in the population from which samples are drawn. Examples: Voter lists, customer databases. Interpretation: The frame must accurately represent the population to avoid bias.
Sample Selection Methods
There are several methods for selecting samples:
Sampling With Replacement: Each selected item is returned to the frame and can be selected again. Example: Drawing names from a bowl and returning them after each draw.
Sampling Without Replacement: Each selected item is not returned and cannot be selected again. Examples: Lottery draws, card games. Interpretation: Generally preferred for producing more desirable samples.
Stratified Sampling: The population is divided into subgroups (strata), and a random sample is taken from each.
Cluster Sampling: The population is divided into clusters, some clusters are randomly selected, and all or some items within those clusters are studied.
Calculator and Spreadsheet Data Entry
Statistical analysis often begins with data entry. Calculators and spreadsheets are common tools for this purpose.
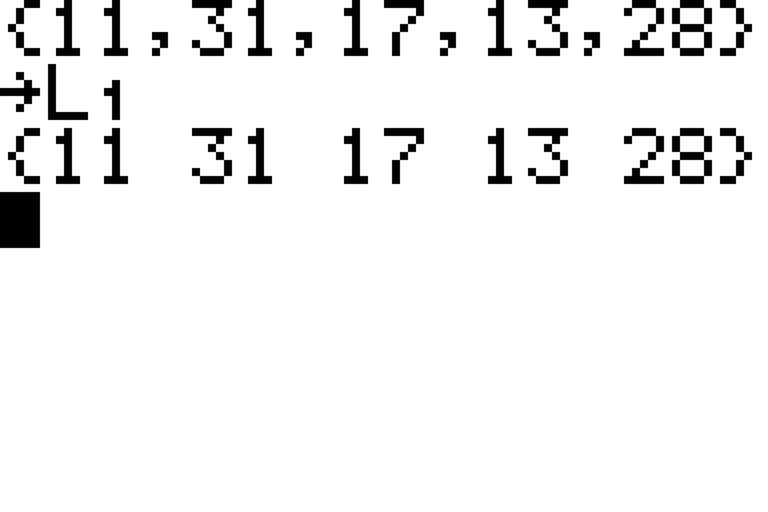
Calculator Data Entry: Enter values separated by commas and store them in a variable (e.g., L1). For multiple variables, use the edit function to enter data in columns.
Spreadsheet Data Entry: Enter variable names in the first row and data values in subsequent rows. Each column represents a variable.
Summary Table: Types of Variables
Type | Definition | Examples |
|---|---|---|
Categorical | Values from a set list of categories | Gender, academic major, marital status |
Numerical (Discrete) | Countable values | Number of elections voted in, number of credit cards |
Numerical (Continuous) | Measurable values, can take any value within a range | Household income, height, distance driven |
Key Formulas
Population Mean:
Sample Mean:
Test Yourself: Sample Questions
The portion of the population selected for analysis is called a sample.
A summary measure computed from a sample is called a statistic.
The height of an individual is a continuous variable.
The body style of an automobile is a categorical variable.
The number of credit cards in a wallet is a discrete variable.
Summary
This chapter introduced the essential vocabulary and concepts of statistics, including types of variables, branches of statistics, sources of data, and sampling methods. Mastery of these fundamentals is crucial for understanding more advanced statistical methods and for effective data analysis in various fields.
