 Back
BackGrade 7 Math Final Exam Study Guide – Statistics & Geometry
Study Guide - Smart Notes
 Tailored notes based on your materials, expanded with key definitions, examples, and context.
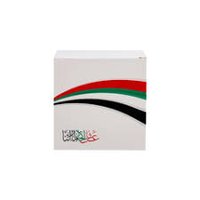
Q1. What is the surface area of a cube-shaped storage box with a side length of 6 cm?
Background
Topic: Surface Area of 3D Shapes
This question tests your understanding of how to calculate the surface area of a cube using its side length.
Key formula:
= side length of the cube (in cm)
Step-by-Step Guidance
Identify the side length: cm.
Recall that a cube has 6 faces, each with area .
Set up the formula: .
Calculate (but do not multiply by 6 yet).
Try solving on your own before revealing the answer!
Final Answer: 216 cm2
cm
The surface area is found by multiplying the area of one face by the number of faces.
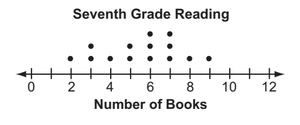
Q2. What is the range of the data shown in the dot plot of books read by seventh grade students?
Background
Topic: Measures of Spread (Range)
This question tests your ability to interpret dot plots and calculate the range of a data set.
Key terms:
Range: The difference between the highest and lowest values in a data set.
Step-by-Step Guidance
Examine the dot plot to find the smallest and largest values represented.
Identify the lowest number of books read and the highest number of books read.
Set up the formula: .
Subtract the minimum from the maximum (do not compute the final value yet).

Try solving on your own before revealing the answer!
Final Answer: 8
The range shows the spread between the lowest and highest number of books read.
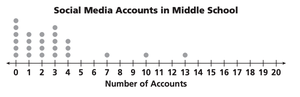
Q3. Which option best describes the shape of the data in the middle school dot plot?
Background
Topic: Data Distribution & Shape
This question tests your ability to interpret the shape of a distribution from a dot plot.
Key terms:
Distribution: How data points are spread across values.
Outlier: A value much higher or lower than most others.
Step-by-Step Guidance
Look at the dot plot and observe where most data points are clustered.
Check if the data is skewed to one side or if there are any outliers.
Compare the options to the observed distribution.
Identify which option best matches the shape (do not select the final answer yet).
Try solving on your own before revealing the answer!
Final Answer: Most of the data points are less than 2.
The dot plot shows most values clustered at 0, 1, and 2 accounts.
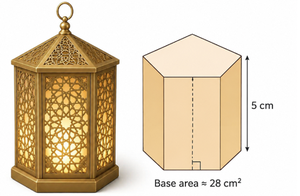
Q4. What is the approximate volume of a regular pentagonal prism with a base area of 28 cm² and height of 5 cm?
Background
Topic: Volume of Prisms
This question tests your ability to calculate the volume of a prism using its base area and height.
Key formula:
Base Area = 28 cm²
Height = 5 cm
Step-by-Step Guidance
Identify the base area and height from the question.
Set up the formula: .
Multiply the base area by the height (do not compute the final value yet).
Try solving on your own before revealing the answer!
Final Answer: 140 cm3
cm
The volume is found by multiplying the base area by the height.
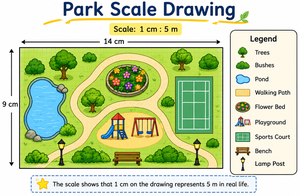
Q5. A park district is building an outdoor tennis court based on a scale drawing that measures 14 cm by 9 cm. The scale is 1 cm: 5 m.
Background
Topic: Scale Drawings & Proportions
This question tests your ability to use a scale drawing to find actual dimensions and compare them to available land.
Key formula:
Scale: 1 cm on drawing = 5 m in real life
Step-by-Step Guidance
Identify the drawing dimensions: 14 cm by 9 cm.
Multiply each dimension by the scale factor (5 m/cm).
Calculate the actual length and width (do not compute the final values yet).
Compare the actual court size to the available land (65 m by 50 m).
Set up the comparison to decide if the court fits (do not conclude yet).
Try solving on your own before revealing the answer!
Final Answer: Actual court size is 70 m by 45 m; it fits on the available land.
Multiplying the drawing dimensions by the scale factor gives the real court size. Since 70 m < 65 m and 45 m < 50 m, the court fits.
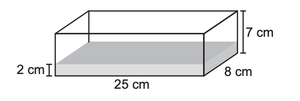
Q6. Mr. Khalid is using plaster to fill a mold for a construction model. The mold is partially filled and has a known total capacity.
Background
Topic: Volume of Rectangular Prisms
This question tests your ability to calculate the total volume, used volume, and remaining volume in a rectangular prism.
Key formula:
Length = 25 cm, Width = 8 cm, Height = 7 cm
Step-by-Step Guidance
Calculate the total volume using all three dimensions.
Calculate the volume already filled (using the filled height, 2 cm).
Subtract the filled volume from the total volume to find the empty space.
Compare the remaining plaster to the empty space to decide if it is enough (do not conclude yet).
Try solving on your own before revealing the answer!
Final Answer: Total volume is 1400 cm3; filled volume is 400 cm3; empty space is 1000 cm3.
Compare the remaining plaster to the empty space to determine if it is sufficient.
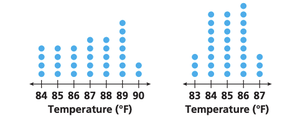
Q7. The dot plots below show the high temperatures recorded in Abu Dhabi and Fujairah during May. Calculate the median temperature for each city and compare the modes.
Background
Topic: Measures of Central Tendency (Median & Mode)
This question tests your ability to find the median and mode from dot plots and compare distributions.
Key terms:
Median: The middle value when data is ordered.
Mode: The value that appears most frequently.
Step-by-Step Guidance
Count the number of data points for each city.
Order the data and find the middle value for the median.
Identify the value with the most dots for the mode.
Compare the modes and explain what they reveal about the most common temperatures.
Try solving on your own before revealing the answer!
Final Answer: Median for Abu Dhabi is 87°F; median for Fujairah is 85°F. Mode for Abu Dhabi is 88°F; mode for Fujairah is 85°F.
The mode shows the most common temperature experienced in each city.
Q8. Safa makes cakes in a pan shaped like a rectangular prism. The base of the pan is an 8-inch by 12-inch rectangle, and the volume of the pan is 288 cubic inches. Explain how the height is calculated and identify the error in the student’s working.
Background
Topic: Volume and Surface Area of Rectangular Prisms
This question tests your ability to correctly use formulas for volume and surface area, and to spot calculation errors.
Key formulas:
Base Area =
Perimeter =
Step-by-Step Guidance
Calculate the base area: .
Set up the volume formula: .
Identify the error: The student added the sides instead of multiplying for base area.
Set up the correct formula for surface area (do not compute the final value yet).
Try solving on your own before revealing the answer!
Final Answer: Height is 3 in; surface area is 120 in2.
The error was in calculating base area by addition instead of multiplication.
Q9. A farmer recorded the number of oranges and apples produced by his trees over one week. The dot plots below show the data collected. Calculate the mean for each fruit and compare their consistency.
Background
Topic: Measures of Central Tendency and Spread
This question tests your ability to calculate the mean, compare means, and analyze the spread of data using dot plots.
Key formulas:
: Look at the range and clustering of data points.
Mean: Average number produced
Spread: Consistency of production
Step-by-Step Guidance
Count the number of data points for each fruit.
Add up all the values for oranges and apples.
Divide the sum by the number of data points to find the mean (do not compute the final value yet).
Compare the means and discuss what this tells you about production.
Analyze the spread of each dot plot to decide which fruit has more consistent production.
Use both mean and spread to recommend which fruit to focus on (do not conclude yet).
Try solving on your own before revealing the answer!
Final Answer: Mean for oranges is 6; mean for apples is 4. Oranges have more consistent production.
The mean and spread show that oranges are produced in higher and more consistent numbers.
