 Back
BackGuided Study Notes for Probability, Normal, and Sampling Distributions
Study Guide - Smart Notes
 Tailored notes based on your materials, expanded with key definitions, examples, and context.
Q1. What is a probability distribution? Give an example.
Background
Topic: Probability Distributions
This question tests your understanding of what a probability distribution is and your ability to provide a concrete example.
Key Terms:
Probability Distribution: A function that describes the likelihood of possible outcomes in a random experiment.
Random Variable: A variable whose value is determined by the outcome of a random experiment.
Step-by-Step Guidance
Start by defining a probability distribution in your own words. Think about how it assigns probabilities to each possible value of a random variable.
Recall that the sum of all probabilities in a probability distribution must equal 1.
Think of a simple random experiment (like flipping a coin or rolling a die) and describe the probability distribution for that experiment.
Try solving on your own before revealing the answer!
Q2. What is the expected value (mean) of a discrete random variable? How is it calculated?
Background
Topic: Expected Value of Discrete Random Variables
This question is about calculating the mean (expected value) of a discrete random variable using its probability distribution.
Key Formula:
= possible value of the random variable
= probability of
Step-by-Step Guidance
List all possible values of the random variable and their associated probabilities.
Multiply each value by its probability: .
Add up all these products to get the expected value.
Try solving on your own before revealing the answer!
Q3. What is the variance and standard deviation of a discrete random variable? How are they calculated?
Background
Topic: Variance and Standard Deviation of Discrete Random Variables
This question tests your ability to compute the spread (variance and standard deviation) of a probability distribution.
Key Formulas:
Variance:
Standard Deviation:
= possible value
= mean (expected value)
= probability of
Step-by-Step Guidance
Find the mean using the expected value formula.
For each value, calculate .
Multiply each squared difference by its probability: .
Add up all these products to get the variance.
Take the square root of the variance to get the standard deviation.
Try solving on your own before revealing the answer!
Q4. What is a normal distribution? What are its key properties?
Background
Topic: Normal Probability Distribution
This question is about understanding the characteristics of the normal distribution, a fundamental concept in statistics.
Key Terms:
Normal Distribution: A continuous probability distribution that is symmetric about the mean, with a bell-shaped curve.
Mean (): Center of the distribution.
Standard Deviation (): Measures the spread of the distribution.
Step-by-Step Guidance
Describe the shape of the normal distribution (bell-shaped, symmetric).
List the key properties: mean, median, and mode are equal; the curve is symmetric about the mean; total area under the curve is 1.
Mention the empirical rule (68-95-99.7%) for standard deviations from the mean.
Try solving on your own before revealing the answer!
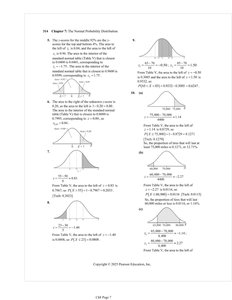
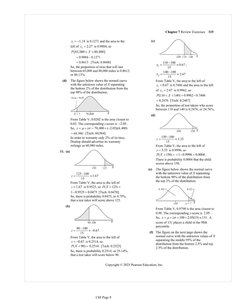
Q5. How do you find probabilities using the standard normal distribution (z-scores)?
Background
Topic: Standard Normal Distribution and Z-scores
This question tests your ability to use z-scores and standard normal tables to find probabilities.
Key Formula:
= value of interest
= mean
= standard deviation
Step-by-Step Guidance
Calculate the z-score for the value of interest using the formula above.
Use the standard normal table (z-table) to find the probability corresponding to the calculated z-score.
Interpret the probability in the context of the problem (e.g., area to the left or right of the z-score).
Try solving on your own before revealing the answer!
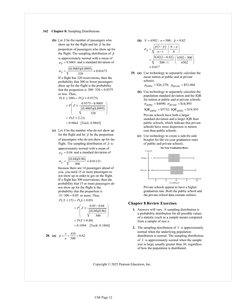
Q6. What is a sampling distribution? Why is it important?
Background
Topic: Sampling Distributions
This question is about understanding the concept of a sampling distribution and its role in inferential statistics.
Key Terms:
Sampling Distribution: The probability distribution of a statistic (like the mean) based on a random sample.
Central Limit Theorem: States that the sampling distribution of the sample mean approaches a normal distribution as the sample size increases, regardless of the population's distribution.
Step-by-Step Guidance
Define what a sampling distribution is in your own words.
Explain why sampling distributions are important for making inferences about populations from samples.
Mention the Central Limit Theorem and its implications for the shape of the sampling distribution of the mean.
Try solving on your own before revealing the answer!
