Back
BackHypothesis Testing and Confidence Intervals for Two Populations – Study Guide
Study Guide - Smart Notes
 Tailored notes based on your materials, expanded with key definitions, examples, and context.
Q1. A researcher wants to perform a hypothesis test to determine whether the mean length of marriages in California differs from the mean length of marriages in Texas. Identify the two populations for the proposed hypothesis test.
Background
Topic: Hypothesis Testing for Two Means
This question is testing your understanding of how to define the populations involved in a two-sample hypothesis test.
Key Terms:
Population: The entire group you want to draw conclusions about (e.g., all marriages in California).
Sample: A subset of the population used to estimate characteristics of the whole group.
Step-by-Step Guidance
Identify the two groups being compared: marriages in California and marriages in Texas.
State each population clearly (e.g., all marriages in California, all marriages in Texas).
Try solving on your own before revealing the answer!
Q2. A researcher wants to perform a hypothesis test to determine whether the mean length of marriages in California differs from the mean length of marriages in Texas. Identify the variable for the proposed hypothesis test.
Background
Topic: Identifying Variables in Hypothesis Testing
This question is about recognizing the variable being measured in a two-sample hypothesis test.
Key Terms:
Variable: The characteristic or measurement being studied (e.g., length of marriage in years).
Step-by-Step Guidance
Consider what is being measured for each marriage in both states.
Express the variable in clear terms (e.g., number of years a marriage lasts).
Try solving on your own before revealing the answer!
Q3. Determine the null and alternative hypotheses for the proposed hypothesis test: A researcher wants to perform a hypothesis test to determine whether the mean length of marriages in California differs from the mean length of marriages in Texas.
Background
Topic: Formulating Hypotheses for Two-Sample Tests
This question tests your ability to write null and alternative hypotheses for comparing two population means.
Key Terms and Formulas:
Null Hypothesis (): Assumes no difference between the population means ().
Alternative Hypothesis (): Assumes a difference exists ().
Step-by-Step Guidance
Define as the mean length of marriages in California and as the mean length in Texas.
Write the null hypothesis: .
Write the alternative hypothesis: .
Try solving on your own before revealing the answer!
Q4. Classify the proposed hypothesis test as Two-tailed, Left-tailed, or Right-tailed: A researcher wants to perform a hypothesis test to determine whether the mean length of marriages in California differs from the mean length of marriages in Texas.
Background
Topic: Types of Hypothesis Tests
This question is about recognizing the directionality of the test based on the alternative hypothesis.
Key Terms:
Two-tailed test: Tests for any difference ().
Left-tailed test: Tests if one mean is less than the other ().
Right-tailed test: Tests if one mean is greater than the other ().
Step-by-Step Guidance
Look at the wording: "differs from" indicates any difference, not a specific direction.
Recall that "differs from" corresponds to a two-tailed test.
Try solving on your own before revealing the answer!
Q5. A confidence interval (CI) for the difference between two population means is given. Interpret the confidence interval: 95% CI goes from 196 to 284.
Background
Topic: Interpreting Confidence Intervals for Two Means
This question tests your ability to interpret what a confidence interval means in the context of two population means.
Key Terms:
Confidence Interval (CI): A range of values that likely contains the true difference between two population means.
Level of Confidence: The probability that the interval contains the true difference (e.g., 95%).
Step-by-Step Guidance
State what the interval (196 to 284) represents in terms of the difference .
Explain what it means to be 95% confident in this context.
Discuss whether zero is included in the interval and what that implies about the difference between means.
Try solving on your own before revealing the answer!
Q6. A variable of two populations has a mean of 71 and a standard deviation of 10 for one of the populations. Random samples of size 25 are drawn from each population. Find the mean and standard deviation of the sampling distribution of the difference between sample means, .
Background
Topic: Sampling Distribution of the Difference Between Means
This question is about finding the mean and standard deviation of the sampling distribution for the difference between two sample means.
Key Formulas:
Mean of :
Standard deviation of :
Step-by-Step Guidance
Identify the given values: , , (and similar for the second population if provided).
Plug the values into the formulas for the mean and standard deviation of the sampling distribution.
Simplify the expressions as much as possible before calculating.
Try solving on your own before revealing the answer!
Q7. A variable of two populations has a mean of 71 and standard deviation of 10 for one of the populations. Random samples of size 25 are drawn from each population. Find the mean and standard deviation of the sampling distribution of the difference between sample means, .
Background
Topic: Sampling Distribution of the Difference Between Means
This question is similar to Q6 and reinforces the same concepts.
Key Formulas:
Mean:
Standard deviation:
Step-by-Step Guidance
List the values for means, standard deviations, and sample sizes for both populations.
Substitute the values into the formulas for the mean and standard deviation of the difference between sample means.
Try solving on your own before revealing the answer!
Q8. Summary statistics are given for independent simple random samples from two populations. Preliminary data analyses indicate that you can reasonably assume the population standard deviations are equal. Use the pooled t-interval procedure to obtain the specified confidence interval.
Background
Topic: Pooled t-Interval for Two Means
This question is about constructing a confidence interval for the difference between two means using the pooled standard deviation.
Key Formula:
Pooled standard deviation:
Confidence interval:
Step-by-Step Guidance
Calculate the pooled standard deviation using the sample sizes and sample standard deviations.
Find the appropriate value for the desired confidence level and degrees of freedom.
Plug the sample means, , and into the confidence interval formula.
Try solving on your own before revealing the answer!
Q9. Summary statistics are given for independent simple random samples from two populations. Use the pooled t-interval procedure to obtain the specified confidence interval: . Determine a 95% confidence interval.
Background
Topic: Pooled t-Interval for Two Means
This question is about applying the pooled t-interval formula to real data.
Key Formula:
Pooled standard deviation:
Confidence interval:
Step-by-Step Guidance
Calculate using the provided sample sizes and standard deviations.
Find the value for a 95% confidence level with the appropriate degrees of freedom.
Substitute the sample means, , and into the confidence interval formula.
Try solving on your own before revealing the answer!
Q10. Perform a right-tailed hypothesis test using a significance level of 0.05. Summary statistics are given for independent simple random samples from two populations. Use the pooled t-test to conduct the required hypothesis test.
Background
Topic: Pooled t-Test for Two Means
This question is about conducting a right-tailed hypothesis test for the difference between two means using the pooled t-test.
Key Formula:
Test statistic:
Pooled standard deviation:
Step-by-Step Guidance
Calculate the pooled standard deviation using the sample data.
Compute the test statistic using the sample means, , and sample sizes.
Compare the test statistic to the critical value or use the p-value approach to decide whether to reject .
Try solving on your own before revealing the answer!
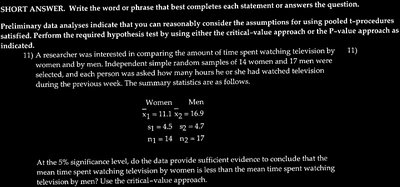
Q11. A researcher is interested in comparing the amount of time spent watching television by women and by men. Independent simple random samples of 14 women and 17 men were selected, and each person was asked how many hours he or she had watched television during the previous week. The summary statistics are as follows: Women: ; Men: . At the 5% significance level, do the data provide sufficient evidence to conclude that the mean time spent watching television by women is less than the mean time spent watching television by men? Use the critical-value approach.
Background
Topic: One-Tailed Hypothesis Test for Two Means (Pooled t-Test)
This question is about testing whether the mean for one group is less than the mean for another group using a pooled t-test.
Key Formula:
Test statistic:
Pooled standard deviation:
Step-by-Step Guidance
State the null and alternative hypotheses: , .
Calculate the pooled standard deviation using the sample data.
Compute the test statistic using the sample means, , and sample sizes.
Find the critical value for a left-tailed test at the 5% significance level.
Compare the test statistic to the critical value to determine whether to reject .
Try solving on your own before revealing the answer!
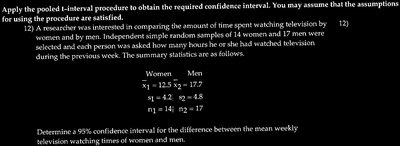
Q12. A researcher is interested in comparing the amount of time spent watching television by women and by men. Independent simple random samples of 14 women and 17 men were selected and each person was asked how many hours he or she had watched television during the previous week. The summary statistics are as follows: Women: ; Men: . Determine a 95% confidence interval for the difference between the mean weekly television watching times of women and men.
Background
Topic: Confidence Interval for the Difference Between Two Means (Pooled t-Interval)
This question is about constructing a confidence interval for the difference in means using the pooled t-interval procedure.
Key Formula:
Pooled standard deviation:
Confidence interval:
Step-by-Step Guidance
Calculate the pooled standard deviation using the sample data.
Find the value for a 95% confidence level with the appropriate degrees of freedom.
Substitute the sample means, , and into the confidence interval formula.
Try solving on your own before revealing the answer!