 Back
BackHypothesis Testing and Statistical Inference: Study Guide for Statistics Students
Study Guide - Smart Notes
 Tailored notes based on your materials, expanded with key definitions, examples, and context.
Hypothesis Testing: Fundamentals
Introduction to Hypothesis Testing
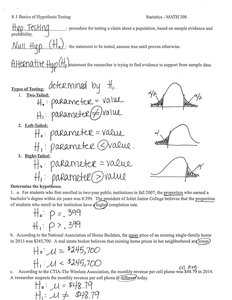
Hypothesis testing is a statistical procedure used to evaluate claims about a population based on sample evidence and probability. It is a cornerstone of inferential statistics, allowing researchers to make decisions or inferences about population parameters.
Null Hypothesis (H0): The statement to be tested; it usually represents no effect or no difference.
Alternative Hypothesis (H1 or Ha): The statement the researcher is trying to find evidence to support; it represents an effect or difference.
Types of Hypothesis Tests
The direction of the test is determined by the form of the alternative hypothesis.
Two-Tailed Test: Tests whether the parameter is different from a specific value (not equal).
Left-Tailed Test: Tests whether the parameter is less than a specific value.
Right-Tailed Test: Tests whether the parameter is greater than a specific value.
Examples of Hypothesis Formulation
Proportion Example: For students at a college, if the completion rate is believed to be higher than 0.399:
Mean Example: If home prices are believed to be lower than H_0: \mu = 245,700H_1: \mu < 245,700$
Difference Example: If monthly revenue per cell phone is suspected to be different from H_0: \mu = 48.79H_1: \mu \neq 48.79$
Test Statistics and Decision Making
Test Statistic Calculation
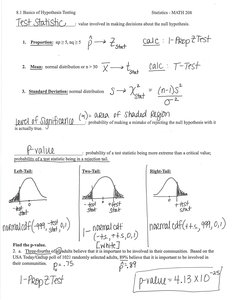
The test statistic is a value calculated from sample data to make decisions about the null hypothesis.
Proportion: , use z-test for proportions.
Mean: Use z-test or t-test depending on sample size and population standard deviation knowledge.
Standard Deviation: Use chi-square () test.
Level of Significance and p-value
Level of Significance (\alpha): The probability threshold for rejecting the null hypothesis, commonly set at 0.05.
p-value: The probability of obtaining a test statistic as extreme as the observed one, assuming the null hypothesis is true.
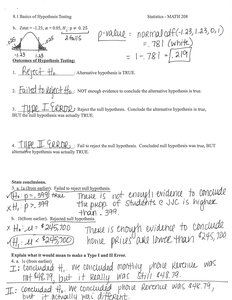
Decision Rules
Reject H0: If p-value < \alpha, there is enough evidence to support the alternative hypothesis.
Fail to Reject H0: If p-value > \alpha, there is not enough evidence to support the alternative hypothesis.
Errors in Hypothesis Testing
Type I Error: Rejecting a true null hypothesis (false positive).
Type II Error: Failing to reject a false null hypothesis (false negative).
Testing Claims about Proportions
p-value Approach
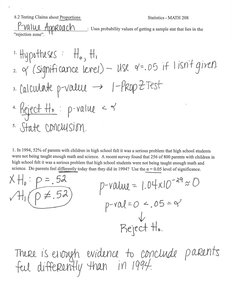
The p-value approach uses probability values to determine whether to reject the null hypothesis.
State hypotheses (, ).
Set significance level ().
Calculate p-value (e.g., 1-PropZTest).
Reject if p-value < \alpha.
State conclusion.
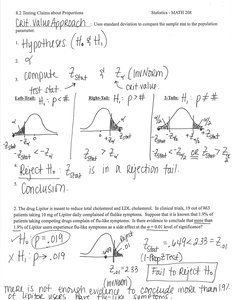
Critical Value Approach
This approach uses standard deviations to compare the sample statistic to the population parameter.
State hypotheses (, ).
Set significance level ().
Compute test statistic ().
Determine critical value ().
Reject if is in the rejection region.
State conclusion.
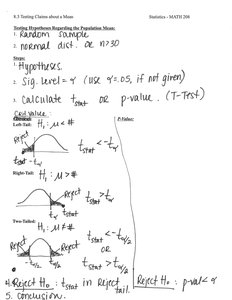
Testing Claims about Means
Testing Hypotheses Regarding the Population Mean
Use random samples and normal distribution (or n > 30).
State hypotheses (, ).
Set significance level ().
Calculate t-statistic or p-value (T-Test).
Reject if t-statistic is in the rejection region or p-value < \alpha.
State conclusion.
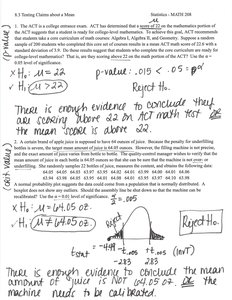
Example Applications
ACT math test scores: , ; p-value < 0.05, reject .
Machine calibration: , ; t-statistic in rejection region, reject .
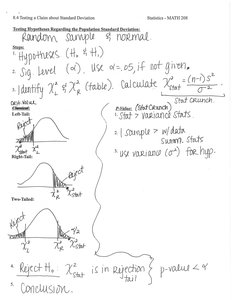
Testing Claims about Standard Deviation
Testing Hypotheses Regarding the Population Standard Deviation
Use random samples and normal distribution.
State hypotheses (, ).
Set significance level ().
Calculate statistic:
Identify critical values from tables.
Reject if is in the rejection region.
State conclusion.
Example Applications
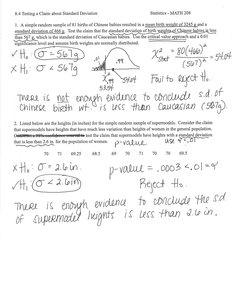
Chinese birth weights: , ; fail to reject .
Supermodel heights: , ; p-value < 0.01, reject .
Summary Table: Hypothesis Testing Approaches
Test Type | Statistic | Distribution | Decision Rule |
|---|---|---|---|
Proportion | z | Normal | p-value or critical value |
Mean | t | t-distribution | p-value or critical value |
Standard Deviation | chi-square () | Chi-square | p-value or critical value |
Additional info: The notes cover hypothesis testing for proportions, means, and standard deviations, including both p-value and critical value approaches, and provide examples and visual aids for each method.
