 Back
BackHypothesis Testing: Concepts, Types, and Procedures
Study Guide - Smart Notes
 Tailored notes based on your materials, expanded with key definitions, examples, and context.
Hypothesis Testing
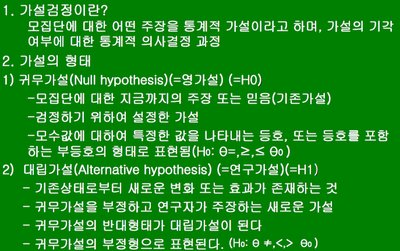
Definition and Purpose
Hypothesis testing is a statistical decision-making process used to determine whether there is enough evidence in a sample of data to infer that a certain condition holds for the entire population. It involves formulating two competing hypotheses and using sample data to decide which hypothesis is more plausible.
Null Hypothesis (H0): The statement being tested, usually representing the status quo or no effect.
Alternative Hypothesis (H1 or HA): The statement we want to test for, indicating the presence of an effect or difference.
Types of Hypotheses
Null and Alternative Hypotheses
Null Hypothesis (H0): Assumes no change or effect. For example, H0: μ = μ0.
Alternative Hypothesis (H1): Represents a new claim or effect. For example, H1: μ ≠ μ0, μ < μ0, or μ > μ0.
Types of Tests Based on Hypothesis Form
Test Directionality
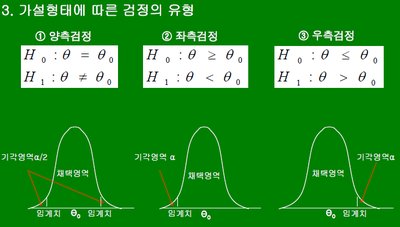
The form of the alternative hypothesis determines the type of test:
Two-tailed test (양측검정): H0: θ = θ0 vs. H1: θ ≠ θ0
Left-tailed test (좌측검정): H0: θ ≥ θ0 vs. H1: θ < θ0
Right-tailed test (우측검정): H0: θ ≤ θ0 vs. H1: θ > θ0
Key Terms in Hypothesis Testing
Test Statistic and Significance Level
Test Statistic: A standardized value calculated from sample data, used to decide whether to reject H0. Common examples include t, Z, χ2, and F statistics.
Significance Level (α): The probability of rejecting H0 when it is actually true (Type I error). Typical values are 0.01, 0.05, or 0.10.

Errors in Hypothesis Testing
Type I and Type II Errors
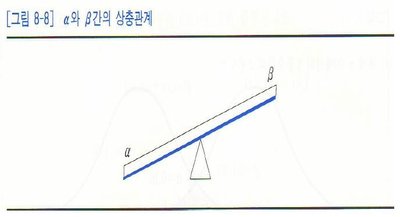
Type I Error (α): Rejecting H0 when it is true.
Type II Error (β): Failing to reject H0 when H1 is true.
There is a trade-off between α and β; decreasing one typically increases the other.
Steps in Hypothesis Testing
Classical and p-value Approaches
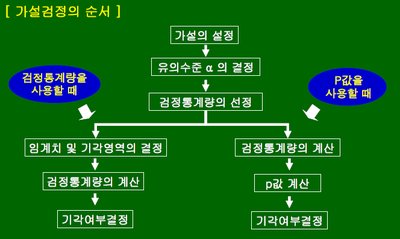
The hypothesis testing procedure can be summarized as follows:
State the hypotheses (H0 and H1).
Choose the significance level α.
Select the appropriate test statistic.
Determine the critical region (classical) or calculate the p-value.
Make a decision: reject or fail to reject H0.
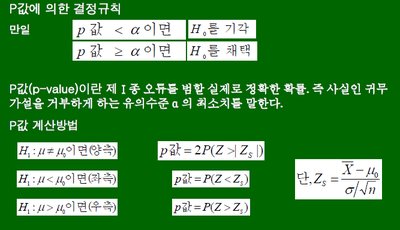
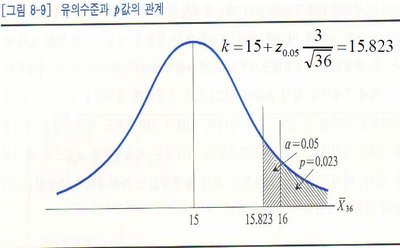
p-value and Decision Rule
Definition and Calculation
p-value: The probability, under H0, of obtaining a result as extreme or more extreme than the observed result. If p-value < α, reject H0.
Calculation: For a Z-test,
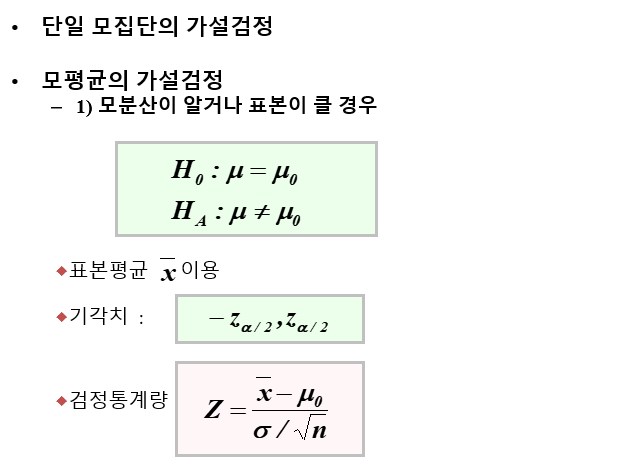
Hypothesis Test for Population Mean (Z-test)
Large Sample or Known Population Variance
Hypotheses: H0: μ = μ0, HA: μ ≠ μ0
Test Statistic:
Critical Values: for two-tailed tests
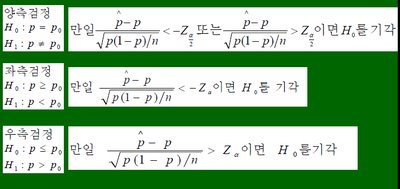
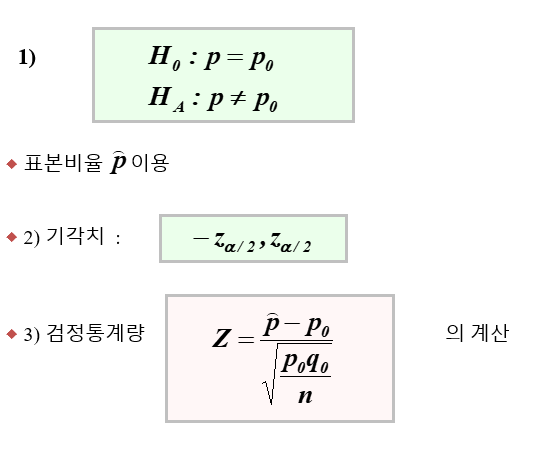
Hypothesis Test for Population Proportion
Test Statistic and Decision Rule
Hypotheses: H0: p = p0, HA: p ≠ p0
Test Statistic:
Critical Values: for two-tailed tests
Summary Table: Types of Errors
H0 True | H1 True | |
|---|---|---|
Do Not Reject H0 | Correct Decision | Type II Error (β) |
Reject H0 | Type I Error (α) | Correct Decision |
Additional info: The notes also emphasize the importance of expressing results as "fail to reject H0" rather than "accept H0" to reflect the logic of statistical inference.
