 Back
BackHypothesis Testing for a Population Mean (σ Unknown): Procedures, Examples, and Interpretation
Study Guide - Smart Notes
 Tailored notes based on your materials, expanded with key definitions, examples, and context.
Testing Claims About a Population Mean (σ Not Known)
Introduction to Hypothesis Testing for a Mean
Hypothesis testing for a population mean is a fundamental statistical procedure used to determine whether there is enough evidence in a sample to support a specific claim about the population mean, especially when the population standard deviation (σ) is unknown. This process is essential in scientific research, quality control, and many applied fields.
Objective: Use a formal hypothesis test to evaluate claims about a population mean (μ) when σ is not known.
Notation:
n = sample size
s = sample standard deviation
\bar{x} = sample mean
μ = population mean (the value specified in the null hypothesis H₀)
Requirements for the t-Test
The sample must be a simple random sample.
Either the population is normally distributed, or the sample size is large (n > 30) due to the Central Limit Theorem.
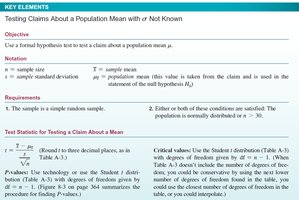
Test Statistic for a Mean (σ Unknown)
When the population standard deviation is unknown, the test statistic is calculated using the Student t-distribution:
Degrees of freedom (df) = n - 1
Critical values are obtained from the t-distribution table based on the chosen significance level (α) and df.
Step-by-Step Procedure for Hypothesis Testing
1. Establish Hypotheses
Null Hypothesis (H₀): States that the population mean is equal to a specified value (e.g., μ = μ₀).
Alternative Hypothesis (H₁): States the claim to be tested (e.g., μ ≠ μ₀, μ < μ₀, or μ > μ₀).
2. Choose the Significance Level (α)
Common choices are 0.05 (5%) or 0.01 (1%).
α represents the probability of making a Type I error (rejecting H₀ when it is true).
3. Compute the Test Statistic
Calculate the sample mean (\bar{x}), sample standard deviation (s), and sample size (n).
Use the formula for t (see above).
4. Find the P-Value
The p-value is the probability of obtaining a test statistic as extreme as, or more extreme than, the observed value under H₀.
Compare the p-value to α to make a decision.
5. Make a Decision
If p-value < α, reject H₀.
If p-value ≥ α, fail to reject H₀.
6. State the Conclusion in Context
Restate the result in terms of the original claim, not just in terms of H₀ or H₁.
Worked Examples
Example 1: Three-Minute Hourglass Timer
Jo-jo tests whether shaking a sand timer affects the elapsed time. She collects 36 measurements and tests the claim that the average time is not 180 seconds.
H₀: μ = 180 sec
H₁ (Claim): μ ≠ 180 sec
α: 0.05
Calculate t using the sample data (not shown in detail here).
Find the p-value and compare to α.
Decision: Reject or fail to reject H₀.
Conclusion: There (IS / IS NOT) enough evidence to (SUPPORT / REJECT) the claim that the time elapsed isn’t 180 seconds.

Example 2: Weight of Circulated Quarters
Claim: The mean weight of circulated quarters is less than the production weight of 5.67 g.
Sample Data: n = 50, \bar{x} = 5.6218 g, s = 0.0682 g, SE = 0.0096 g
H₀: μ = 5.67 g
H₁ (Claim): μ < 5.67 g
α: 0.01
Calculate t and p-value.
Decision: Reject or fail to reject H₀.
Conclusion: There (IS / IS NOT) enough evidence to (SUPPORT / REJECT) the claim that quarters in circulation weigh less than 5.67 g.
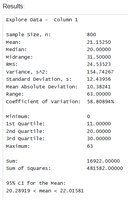
Example 3: Mean Age of Pennies in Circulation
Claim: The mean age of a penny in circulation is 20 years.
Sample Data: n = 800, \bar{x} = 21.153, s = 12.44
H₀: μ = 20
H₁ (Claim): μ ≠ 20
α: 0.05
Calculate t and p-value.
Decision: Reject or fail to reject H₀.
Conclusion: There (IS / IS NOT) enough evidence to (SUPPORT / REJECT) the claim that the average age is 20 years.

Confidence Intervals and Hypothesis Testing
A 95% confidence interval (CI) for the mean provides a range of plausible values for the population mean. If the value specified in H₀ is outside the CI, H₀ would be rejected at the 5% significance level.
For the penny age example, the 95% CI is approximately (20.289, 22.015).
Since 20 is within this interval, we would not reject H₀ at α = 0.05.
Summary Table: Steps in Hypothesis Testing for a Mean (σ Unknown)
Step | Description |
|---|---|
1. Hypotheses | State H₀ and H₁ based on the claim |
2. Significance Level | Choose α (e.g., 0.05 or 0.01) |
3. Test Statistic | Calculate t using sample data |
4. P-Value | Find probability of observed t under H₀ |
5. Decision | Compare p-value to α; reject or fail to reject H₀ |
6. Conclusion | State result in terms of the original claim |
Key Terms and Concepts
Null Hypothesis (H₀): The default assumption about a population parameter.
Alternative Hypothesis (H₁): The claim being tested.
Significance Level (α): Probability of Type I error.
Test Statistic (t): Measures how far the sample mean is from the hypothesized mean in standard error units.
P-Value: Probability of observing a result as extreme as the sample, assuming H₀ is true.
Confidence Interval: Range of values likely to contain the population mean.
