 Back
Hypothesis Testing for One Proportion: P-value Approach
Study Guide - Smart Notes
 Tailored notes based on your materials, expanded with key definitions, examples, and context.
Hypothesis Testing for One Proportion
P-value Approach to Hypothesis Testing
This section explains how to test a claim about a population proportion using the P-value approach. The process involves stating hypotheses, calculating a test statistic, determining the P-value, and making a conclusion based on the significance level.
Step 1: State the Hypotheses
Null Hypothesis (H0): The population proportion equals a specified value.
Alternative Hypothesis (H1): The population proportion differs from the specified value (can be greater, less, or not equal).
Example: Original claim: p > 0.019 H0: p = 0.019 H1: p > 0.019
Step 2: Calculate the Test Statistic
The test statistic for a proportion is a z-score, calculated as: where: - = sample proportion - = hypothesized proportion - = sample size
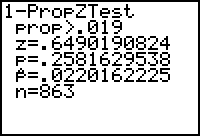
Example: z = 0.65
Step 3: Determine the P-value
The P-value is the probability of obtaining a result at least as extreme as the observed result, assuming the null hypothesis is true.
Compare the P-value to the significance level ().
Example: P-value = 0.2582, = 0.01
Step 4: State the Conclusion
If P-value ≤ , reject H0.
If P-value > , fail to reject H0.
Example: Since 0.2582 > 0.01, fail to reject H0.
There is not enough evidence to support the claim that the percentage of treated patients with flu symptoms is greater than the 1.9% rate for patients not given the treatments.
Worked Example: Clinical Test of Lipitor
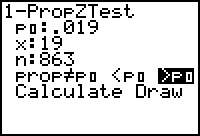
In clinical tests of the drug Lipitor, 863 patients were treated with 10 mg doses, and 19 experienced flu symptoms. The claim is that the percentage of treated patients with flu symptoms is greater than the 1.9% rate for untreated patients. The significance level is 0.01.
Sample size (n): 863
Number with flu symptoms (x): 19
Sample proportion ():
Hypothesized proportion (): 0.019
Test statistic (z): 0.65
P-value: 0.2582
Conclusion: Fail to reject H0. No evidence that flu symptoms are an adverse reaction to the treatment.
Summary Table: Hypothesis Test for Proportion
Step | Description | Example Values |
|---|---|---|
State Hypotheses | H0: p = 0.019 H1: p > 0.019 | Claim: p > 0.019 |
Calculate Test Statistic | z = | z = 0.65 |
Determine P-value | Probability of observed result under H0 | P-value = 0.2582 |
Conclusion | Compare P-value to | Fail to reject H0 (0.2582 > 0.01) |
Key Terms: Null hypothesis, alternative hypothesis, test statistic, P-value, significance level, sample proportion.
Example Application: This method is used to test claims about proportions in medical studies, surveys, and quality control.
