 Back
Hypothesis Testing for One Sample Mean: Step-by-Step Guide
Study Guide - Smart Notes
 Tailored notes based on your materials, expanded with key definitions, examples, and context.
Hypothesis Testing for One Sample Mean
Overview of Hypothesis Testing
Hypothesis testing is a statistical method used to make decisions about population parameters based on sample data. In this example, we test whether the mean bounce height of new baseballs differs from a known value.
Null Hypothesis (H0): The population mean is equal to the specified value.
Alternative Hypothesis (H1): The population mean is different from the specified value.
Significance Level (α): The probability threshold for rejecting H0, commonly set at 0.05.
Step-by-Step Procedure
Step 1: State the Hypotheses
Formulate the null and alternative hypotheses based on the claim.
Original claim: μ ≠ 92.84
H0: μ = 92.84
H1: μ ≠ 92.84
Step 2: Calculate the Test Statistic
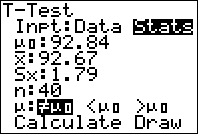
The test statistic measures how far the sample mean is from the hypothesized mean, in units of standard error. For a sample mean, use the t-test:
Sample mean (x̄): 92.67
Sample standard deviation (Sx): 1.79
Sample size (n): 40
Hypothesized mean (μ0): 92.84
The formula for the t-test statistic is:
For this example:
Step 3: Determine the P-value
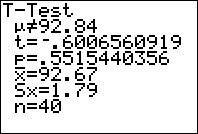
The P-value is the probability of obtaining a result as extreme as the observed one, assuming the null hypothesis is true. Compare the P-value to the significance level (α).
P-value: 0.5515
α: 0.05
Step 4: State the Conclusion
If the P-value is greater than α, fail to reject the null hypothesis. If the P-value is less than or equal to α, reject the null hypothesis.
Since 0.5515 > 0.05, we fail to reject H0.
There is not enough evidence to support the claim that the new baseballs have bounce heights with a mean different from 92.84 inches.
Summary Table: Hypothesis Test Results
Parameter | Value |
|---|---|
Sample Mean (x̄) | 92.67 |
Sample Std. Dev. (Sx) | 1.79 |
Sample Size (n) | 40 |
Hypothesized Mean (μ0) | 92.84 |
Test Statistic (t) | -0.601 |
P-value | 0.5515 |
Significance Level (α) | 0.05 |
Conclusion | Fail to reject H0 |
Example Application
This procedure is commonly used in quality control, scientific research, and business analytics to test claims about population means based on sample data.
Key Terms: Null hypothesis, alternative hypothesis, t-test, P-value, significance level.
Additional info: The t-test is appropriate when the population standard deviation is unknown and the sample size is moderate or large. The calculator screenshots illustrate the input and output for a one-sample t-test.
