 Back
BackHypothesis Testing for One Sample: Proportion and Mean
Study Guide - Smart Notes
 Tailored notes based on your materials, expanded with key definitions, examples, and context.
Hypothesis Testing for One Sample
The Language of Hypothesis Testing
Hypothesis testing is a fundamental procedure in inferential statistics, used to make decisions about population parameters based on sample data. The process involves formulating two competing statements about a population parameter and using sample evidence to determine which statement is more plausible.
Null Hypothesis (H0): A statement of no change, effect, or difference. It is assumed true until evidence suggests otherwise.
Alternative Hypothesis (H1): The statement for which we seek evidence. It represents a change, effect, or difference.
Types of tests:
Two-tailed test: H0: parameter = value; H1: parameter ≠ value
Left-tailed test: H0: parameter = value; H1: parameter < value
Right-tailed test: H0: parameter = value; H1: parameter > value
Example: If a researcher wants to know if the mean lifetime of a light bulb is less than 500 hours, the hypotheses are:
H0: μ = 500
H1: μ < 500
Type I and Type II Errors
When conducting hypothesis tests, two types of errors can occur:
Type I Error (α): Rejecting H0 when it is actually true.
Type II Error (β): Failing to reject H0 when H1 is actually true.
The level of significance (α) is the probability of making a Type I error. Lowering α reduces the chance of a Type I error but increases the chance of a Type II error.
Stating Conclusions
Conclusions are stated in terms of the alternative hypothesis. We never "accept" the null hypothesis; we either reject it or fail to reject it.
"There is sufficient evidence to conclude that..." (if H0 is rejected)
"There is not sufficient evidence to conclude that..." (if H0 is not rejected)
Hypothesis Tests for a Population Proportion
Logic of Hypothesis Testing
Hypothesis testing evaluates whether observed sample results are unlikely under the assumption that the null hypothesis is true. If so, the result is statistically significant, and H0 is rejected.
Classical Approach: Compare the test statistic to a critical value.
P-value Approach: The P-value is the probability of observing a result as extreme as the sample, assuming H0 is true. If P-value < α, reject H0.
Confidence Interval Approach: If the hypothesized value is not within the confidence interval, reject H0.
Testing Hypotheses about a Population Proportion
To test hypotheses about a population proportion, follow these steps:
Verify Assumptions:
Simple random sample or randomized experiment
np0 ≥ 10 and nq0 ≥ 10
Sampled values are independent (n ≤ 0.05N)
State Hypotheses: Structure as two-tailed, left-tailed, or right-tailed.
Select Level of Significance (α): Common values are 0.05, 0.01, or 0.10.
Calculate Test Statistic:
Test statistic for proportion:
Find P-value or Critical Value: Use statistical tables or calculator functions.
Make a Decision: Compare P-value to α or test statistic to critical value.
State Conclusion: Interpret in context of the problem.
Hypothesis Tests for a Population Mean
Testing Hypotheses about a Mean
When testing hypotheses about a population mean, the t-distribution is used if the population standard deviation is unknown and the sample size is small. The steps are similar to those for proportions, with the following test statistic:
Test statistic for mean:
Where:
\( \bar{x} \) = sample mean
\( \mu_0 \) = hypothesized population mean
\( s \) = sample standard deviation
\( n \) = sample size
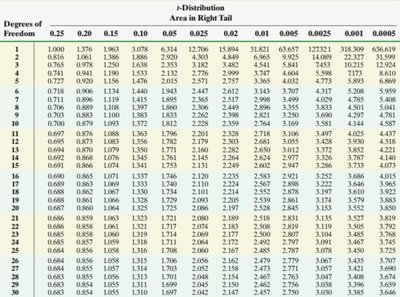
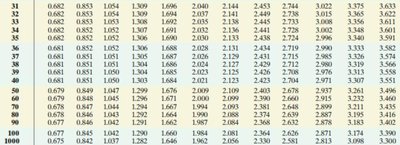
Degrees of freedom (df) = n - 1.
Using the t-Distribution Table
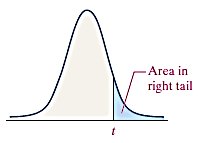
The t-distribution table provides critical values for various significance levels and degrees of freedom. These values are used to determine rejection regions for hypothesis tests involving means.
Statistical vs. Practical Significance
Statistical significance means that the observed effect is unlikely to have occurred by chance, given the null hypothesis. Practical significance considers whether the effect size is large enough to be meaningful in real-world terms. A result can be statistically significant but not practically important if the difference is too small to matter in practice.
Summary Table: Types of Errors in Hypothesis Testing
Decision | H0 True | H1 True |
|---|---|---|
Reject H0 | Type I Error (α) | Correct Decision |
Do Not Reject H0 | Correct Decision | Type II Error (β) |
Key Formulas
Test Statistic for Proportion:
Test Statistic for Mean:
Confidence Interval for Proportion:
Confidence Interval for Mean:
Additional info: The t-distribution is used instead of the normal distribution when the population standard deviation is unknown and the sample size is small (n < 30). As the sample size increases, the t-distribution approaches the normal distribution.
