 Back
BackHypothesis Testing for Population Mean (σ Unknown) – Step-by-Step Guidance
Study Guide - Smart Notes
 Tailored notes based on your materials, expanded with key definitions, examples, and context.
Q1. Use the P-value method with a 0.05 significance level to test the claim that the mean amount of sleep for adults is less than 7 hours.
Background
Topic: Hypothesis Testing for Population Mean (σ Unknown)
This question tests your ability to conduct a hypothesis test for a population mean when the population standard deviation is not known, using the t-distribution and the P-value method.
Key Terms and Formulas
Null hypothesis ():
Alternative hypothesis ():
Sample mean (): 6.833...
Sample standard deviation (): 1.592...
Sample size (): 12
Degrees of freedom ():
Test statistic formula:
Step-by-Step Guidance
State the hypotheses: , (claim is that the mean is less than 7 hours).
Identify the sample statistics: , , .
Calculate the degrees of freedom: .
Set up the test statistic formula: .
Plug in the values for , , , and to compute the t-statistic, but stop before calculating the final value.
Try solving on your own before revealing the answer!
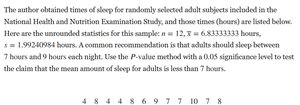
Final Answer: t = -0.36, P-value = 0.36 (Fail to reject )
Using the formula , the calculated t-statistic is approximately -0.36. The P-value is greater than 0.05, so we do not have enough evidence to support the claim that the mean is less than 7 hours.
Q2. Use a 0.05 significance level to test the common belief that the population mean body temperature is 98.6°F.
Background
Topic: Hypothesis Testing for Population Mean (σ Unknown)
This question tests your ability to use the t-distribution to test a claim about a population mean when the population standard deviation is not known, using sample statistics.
Key Terms and Formulas
Null hypothesis ():
Alternative hypothesis ():
Sample mean (): 98.20
Sample standard deviation (): 0.62
Sample size (): 106
Degrees of freedom ():
Test statistic formula:
Step-by-Step Guidance
State the hypotheses: , (two-tailed test).
Identify the sample statistics: , , .
Calculate the degrees of freedom: .
Set up the test statistic formula: .
Plug in the values for , , , and to compute the t-statistic, but stop before calculating the final value.
Try solving on your own before revealing the answer!
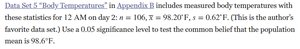
Final Answer: t = -6.13, P-value < 0.05 (Reject )
Using the formula , the calculated t-statistic is approximately -6.13. The P-value is much less than 0.05, so we reject the null hypothesis and conclude that the mean body temperature is significantly different from 98.6°F.
Q3. What is the critical value for a t-test with n = 12?
Background
Topic: t-Distribution Critical Values
This question tests your understanding of how to find the critical value for a t-test using the Student t-distribution and degrees of freedom.
Key Terms and Formulas
Degrees of freedom ():
Critical value: The value from the t-distribution table corresponding to the desired significance level and degrees of freedom.
Step-by-Step Guidance
Calculate the degrees of freedom: .
Identify the significance level (e.g., 0.05 for a two-tailed test).
Look up the critical value in the t-distribution table for and the specified significance level.
If the exact is not available, use the next lower $df$ or interpolate between values.
Try solving on your own before revealing the answer!
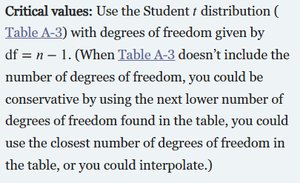
Final Answer: tcritical ≈ 2.201 (for df = 11, two-tailed, α = 0.05)
For and a two-tailed test at the 0.05 significance level, the critical value is approximately 2.201. This value is used to determine the rejection region for the hypothesis test.
