 Back
BackHypothesis Testing for Proportions: Concepts, Errors, and Significance
Study Guide - Smart Notes
 Tailored notes based on your materials, expanded with key definitions, examples, and context.
Hypothesis Testing for Proportions
Introduction to Hypothesis Testing
Hypothesis testing is a fundamental statistical method used to determine whether observed differences in sample data are likely due to chance or reflect true differences in the population. In the context of proportions, we compare observed sample proportions to hypothesized values to assess statistical significance.
Null Hypothesis (H0): The starting assumption, typically stating that there is no effect or difference. For proportions, it is often written as H0: p = p0.
Alternative Hypothesis (Ha): Represents values that would be plausible if the null hypothesis is not true. The form (≠, >, <) depends on the research question.
Sampling Variability: Differences in sample statistics are often due to random chance, not necessarily a real effect.
Example: If 40% of high school graduates went to college in the 1950s, and we want to know if this has changed, we set:
H0: p = 0.40
Ha: p ≠ 0.40
Formulating Hypotheses
Hypotheses should be based on the context of the problem, not on the sample data. The null hypothesis is not what you want to prove; instead, it is the baseline you test against.
Use ≠ for any difference, > for higher, < for lower, depending on the research question.
Always define the parameter (e.g., population proportion p) clearly.
Example: For a new soft drink, marketed only if over 60% like it:
H0: p = 0.60
Ha: p > 0.60
Evidence and the P-Value
The p-value is the probability of observing data as extreme as, or more extreme than, the sample result, assuming the null hypothesis is true. It is not the probability that the null hypothesis is true.
Small p-value (< α): Strong evidence against H0; reject H0.
Large p-value: Weak evidence; fail to reject H0.
Never say you "accept" H0; only that you fail to reject it.
The Hypothesis Testing Process
Think: Understand the context and identify the parameter of interest.
Plan: State hypotheses, choose the appropriate model, and check conditions.
Show: Calculate observed value, standard deviation, test statistic, and p-value. Sketch the model if needed.
Tell: Make a decision based on the p-value and discuss the conclusion in context. If you reject H0, provide a confidence interval.
Alpha Levels and Statistical Significance
The alpha level (α) is the threshold for statistical significance, commonly set at 0.10, 0.05, or 0.01. If the p-value is less than α, the result is statistically significant.
Choosing α depends on the context and consequences of errors.
Reporting the exact p-value allows others to interpret the result based on their own criteria.
Statistical vs. Practical Significance
A statistically significant result means the p-value is below α, but this does not always imply practical importance. The effect size is the difference between the observed statistic and the null value, measured in data units.
Large samples can make small, unimportant differences statistically significant.
Small samples may fail to detect important differences.
Confidence Intervals and Hypothesis Tests
Confidence intervals and hypothesis tests are closely related. A confidence interval provides a range of plausible values for the parameter. If the null value is outside the interval, it would be rejected in a two-sided test at the corresponding α level.
A C% confidence interval corresponds to a two-sided test with α = 100% - C%.
For one-sided tests, the corresponding α is ½(100% - C%).
Errors in Hypothesis Testing
Types of Errors
There are two main types of errors in hypothesis testing:
Type I Error (α): Rejecting a true null hypothesis (false positive).
Type II Error (β): Failing to reject a false null hypothesis (false negative).
The seriousness of each error depends on the context. The probability of a Type I error is the chosen α level. The probability of a Type II error is β, which depends on the true parameter value and is harder to calculate.
Power of a Test
The power of a test is the probability of correctly rejecting a false null hypothesis. It is calculated as 1 - β. High power means the test is likely to detect a real effect if one exists.
Power increases with larger effect size, larger sample size, higher α, and lower variability.
Reducing variability (e.g., through stratification) increases power.
Factors Affecting Power
Higher α increases power but also increases the chance of a Type I error.
Larger effect size makes it easier to detect differences.
Larger sample size reduces the probability of a Type II error (increases power).
Reducing extraneous variability increases power.
Common Pitfalls and Best Practices
Do not interpret the p-value as the probability that H0 is true.
Do not rely solely on arbitrary alpha levels; report p-values and confidence intervals.
Distinguish between statistical and practical significance.
Remember that errors are always possible; increasing sample size helps reduce them but cannot eliminate them.
Do not test multiple hypotheses without proper adjustment.
Summary Table: Types of Errors in Hypothesis Testing
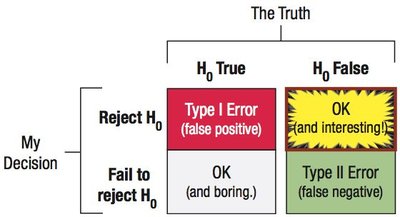
H0 True | H0 False | |
|---|---|---|
Reject H0 | Type I Error (α): False Positive | Correct Decision (Power) |
Fail to Reject H0 | Correct Decision | Type II Error (β): False Negative |
Key Formulas
Test Statistic for Proportion:
P-value: Probability of observing a test statistic as extreme as the one calculated, under H0.
Power:
Additional info: This guide covers the core concepts of hypothesis testing for proportions, including the logic of hypothesis tests, the meaning and interpretation of p-values, the role of alpha levels, the distinction between statistical and practical significance, the relationship between confidence intervals and hypothesis tests, and the types of errors and power in hypothesis testing.
