 Back
BackHypothesis Testing in Statistics: Concepts, Errors, and Interpretation
Study Guide - Smart Notes
 Tailored notes based on your materials, expanded with key definitions, examples, and context.
Hypothesis Testing
Introduction to Hypothesis and Hypothesis Testing
Hypothesis testing is a fundamental statistical method used to make inferences about population parameters based on sample data. It involves formulating two competing hypotheses and using sample evidence to decide which hypothesis is more consistent with the observed data.
Hypothesis: A statement or claim about a property of a population.
Hypothesis Test (Test of Significance): A procedure to test a claim about a population parameter using sample data.

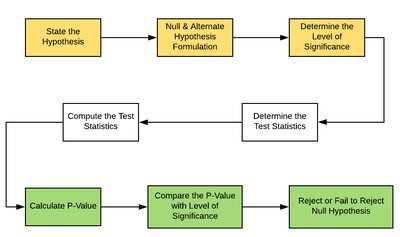
Steps in Hypothesis Testing
The process of hypothesis testing follows a structured sequence of steps to ensure objectivity and reproducibility.
State the hypotheses (null and alternative).
Determine the significance level (α).
Compute the test statistic.
Calculate the p-value.
Compare the p-value with α and make a decision.
Formulating Hypotheses
Null Hypothesis (H0)
The null hypothesis is a statement of no effect, no difference, or no relationship. It is the default assumption that any observed difference is due to sampling or experimental error.
Denoted as H0.
Uses equality symbols (e.g., =, ≤, ≥).
Assumed true until evidence suggests otherwise.
Alternative Hypothesis (H1 or HA)
The alternative hypothesis is a statement that contradicts the null hypothesis. It represents the effect, difference, or relationship the researcher aims to support.
Denoted as H1 or HA.
Uses inequality symbols (<, >, ≠).
Evidence is sought to support this hypothesis.
Examples of Hypotheses
Null Hypothesis: Tooth flossing has no effect on the number of cavities.
Alternative Hypothesis: Tooth flossing has an effect on the number of cavities.
Null Hypothesis: Daily meditation does not decrease the incidence of depression.
Alternative Hypothesis: Daily meditation decreases the incidence of depression.
Significance Level and P-value
Significance Level (α)
The significance level, denoted by α, is the probability threshold for rejecting the null hypothesis. Common values are 0.05, 0.01, and 0.10.
α = P(rejecting H0 when H0 is true)
P-value
The p-value is the probability, under the null hypothesis, of obtaining a result equal to or more extreme than what was actually observed.
If p ≤ α: The result is statistically significant; reject H0.
If p > α: The result is not statistically significant; fail to reject H0.
Interpreting P-values
p > 0.10: Little or no evidence of a difference or relationship.
0.05 < p ≤ 0.10: Weak evidence.
0.01 < p ≤ 0.05: Evidence of a difference or relationship.
p ≤ 0.01: Strong evidence.
p < 0.001: Very strong evidence.
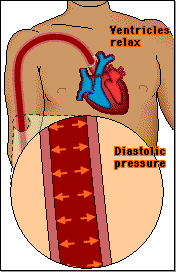
Example: Blood Pressure Before & After Exercise
Research Question: Does exercise change the systolic blood pressure of middle-aged men?
H0: No difference in mean blood pressure before and after exercise (μdifference = 0 mmHg).
HA: There is a difference (μdifference ≠ 0 mmHg).
Result: p = 0.001. Since p < 0.05, reject H0 and conclude there is a significant difference.
Errors in Hypothesis Testing
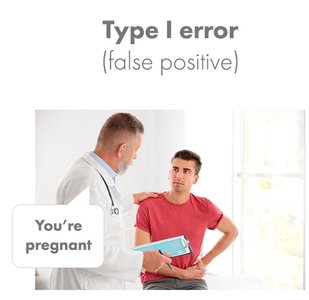
Type I Error (α)
A Type I error occurs when the null hypothesis is incorrectly rejected (a false positive).
Probability of Type I error = α (significance level).
Example: Concluding a treatment works when it does not.
Type II Error (β)
A Type II error occurs when the null hypothesis is not rejected when it is actually false (a false negative).
Probability of Type II error = β.
Example: Failing to detect a real effect of a treatment.

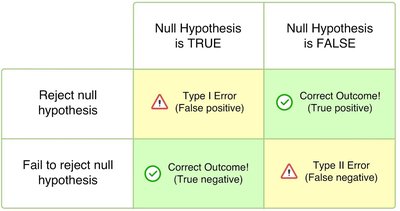
Summary Table: Hypothesis Testing Outcomes
Null Hypothesis is TRUE | Null Hypothesis is FALSE | |
|---|---|---|
Reject null hypothesis | Type I Error (False positive) | Correct Outcome! (True positive) |
Fail to reject null hypothesis | Correct Outcome! (True negative) | Type II Error (False negative) |
Power of a Test and Sample Size
Power
Power is the probability of correctly rejecting the null hypothesis when it is false (i.e., detecting a true effect).
Power = 1 − β
A common requirement is power ≥ 0.80 (80%).
Higher power reduces the likelihood of Type II errors.
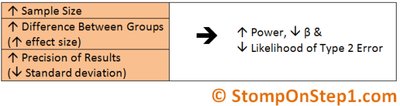
Factors Affecting Power
Increasing sample size increases power.
Larger effect size increases power.
Greater precision (lower standard deviation) increases power.
Limitations and Misconceptions
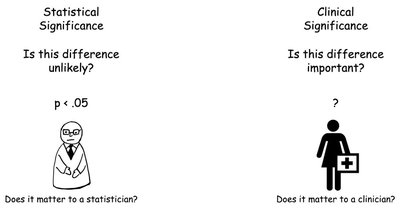
Statistical vs. Clinical Significance
Statistical significance does not necessarily imply practical or clinical importance. A result can be statistically significant but have little real-world impact.
Confidence Intervals and Hypothesis Testing
Confidence Intervals (CI)
Confidence intervals provide a range of values within which the true population parameter is likely to lie, with a specified level of confidence (e.g., 95%).
CI = point estimate ± margin of error
Level of confidence = 1 − α (e.g., 0.95 for 95% CI)

Interpreting Confidence Intervals
If the CI does not include the value specified in H0 (e.g., 0 for mean difference), the result is statistically significant.
If the CI includes the null value, the result is not statistically significant.
Example: The mean difference in systolic blood pressure following exercise was 6.63 mmHg (SD = 5.97 mmHg), 95% CI: 3.71 to 9.55 mmHg. Since the CI does not include 0, the result is statistically significant.
Common Statistical Tests
t-Test: Compares the means of two groups (numerical data).
Chi-squared Test: Compares proportions or percentages of categorical data across groups.
ANOVA (Analysis of Variance): Compares means among three or more groups.
Conclusion to Hypothesis Testing
Report both the p-value and the confidence interval for a comprehensive interpretation.
Consider both statistical and practical significance when drawing conclusions.
