 Back
BackHypothesis Testing: Proportions, Type I & II Errors, and Power
Study Guide - Smart Notes
 Tailored notes based on your materials, expanded with key definitions, examples, and context.
Testing Proportions & Type Errors
The Monty Hall Problem: Probability and Simulation
The Monty Hall problem is a classic probability puzzle that illustrates the importance of strategy in decision-making under uncertainty. In this scenario, a contestant chooses one of three doors, behind one of which is a prize. After the initial choice, one non-winning door is revealed, and the contestant must decide whether to stick with their original choice or switch to the remaining unopened door.
Probability of Winning by Staying: The probability of winning if the contestant stays with their first choice is .
Probability of Winning by Switching: The probability of winning if the contestant switches is .
Simulation: To empirically estimate these probabilities, students can simulate the game multiple times and record the outcomes.
Example: If a contestant initially picks Door 1 and the host reveals Door 2 as a non-winner, switching to Door 3 increases the chance of winning to 2/3.
Hypothesis Testing for Proportions
Hypothesis testing allows us to evaluate claims about population proportions using sample data. In the Monty Hall context, we can test the claim that the probability of winning by switching is 50%.
Establish Hypotheses:
Null Hypothesis (): (probability of winning by switching is 50%)
Alternative Hypothesis ():
Significance Level (): The threshold for "reasonable doubt" is typically set at (5%).
Test Statistic: For proportions, the test statistic is calculated as: where is the sample proportion, is the hypothesized proportion, and is the sample size.
P-Value: The p-value is the probability of observing a test statistic as extreme as, or more extreme than, the observed value under the null hypothesis.
Decision: If the p-value is less than , reject ; otherwise, fail to reject $H_0$.
Conclusion: State the result in terms of the original claim.
Example: If the observed proportion of wins by switching is significantly greater than 0.5, we reject the null hypothesis and conclude there is evidence that switching increases the probability of winning.
Type I and Type II Errors
Definitions and Consequences
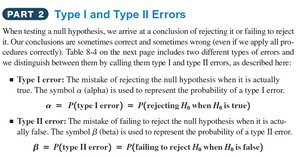
When conducting hypothesis tests, two types of errors can occur:
Type I Error (): Rejecting the null hypothesis when it is actually true. This is also known as a "false positive." The probability of a Type I error is denoted by .
Type II Error (): Failing to reject the null hypothesis when it is actually false. This is also known as a "false negative." The probability of a Type II error is denoted by .
Example (Courtroom Analogy):
Null Hypothesis (): The defendant is innocent.
Alternative Hypothesis (): The defendant is guilty.
Type I Error: Convicting an innocent person ().
Type II Error: Failing to convict a guilty person ().
Adjusting the significance level () affects the probabilities of these errors:
Raising the level of "reasonable doubt" (decreasing ) reduces Type I errors but increases Type II errors.
Lowering the level of "reasonable doubt" (increasing ) increases Type I errors but reduces Type II errors.
To decrease both error probabilities, a larger sample size (more data) is required.
Which Error is Worse? In many contexts, a Type I error is considered more serious, so is set to be as small as possible.
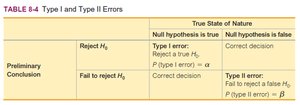
Preliminary Conclusion | Null hypothesis is true | Null hypothesis is false |
|---|---|---|
Reject | Type I error: Reject a true | Correct decision |
Fail to reject | Correct decision | Type II error: Fail to reject a false |
Power of a Hypothesis Test
Definition and Importance
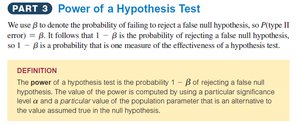
The power of a hypothesis test is the probability of correctly rejecting a false null hypothesis. It is calculated as , where is the probability of a Type II error. High power means the test is effective at detecting an effect when one exists.
Formula:
Factors Affecting Power: Sample size, significance level (), and the true value of the population parameter.
Example: If a test has a power of 0.90, there is a 90% chance of detecting a true effect.
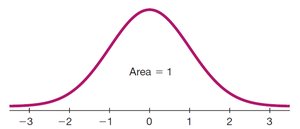
Visualizing the Normal Distribution
Many hypothesis tests rely on the normal distribution, especially when sample sizes are large. The area under the normal curve represents probabilities, and critical values are determined by the chosen significance level.
Summary Table: Type I and Type II Errors
The following table summarizes the possible outcomes of hypothesis testing:
Additional info: Analyzing the power of a hypothesis test is crucial for researchers to ensure their tests are sensitive enough to detect meaningful effects, but detailed calculations are beyond the scope of this introductory course.
