 Back
BackHypothesis Testing: Single Population Mean and Proportion
Study Guide - Smart Notes
 Tailored notes based on your materials, expanded with key definitions, examples, and context.
Hypothesis Testing: Single Population
Introduction to Hypothesis Testing
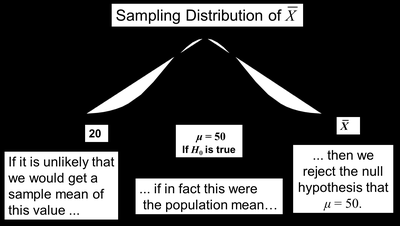
Hypothesis testing is a fundamental statistical method used to make inferences about population parameters based on sample data. It involves formulating two competing hypotheses and using sample evidence to decide which hypothesis is more likely to be true.
Null Hypothesis (H0): The default assumption about a population parameter (e.g., mean, proportion).
Alternative Hypothesis (H1): The hypothesis that contradicts the null and is usually what the researcher aims to support.
Applications: Testing population mean, proportion, or variance.
Formulating Hypotheses
Hypotheses are statements about population parameters. The null hypothesis typically represents the status quo or a specific value, while the alternative hypothesis represents a change or difference.
Null Hypothesis (H0): Always contains equality ( =, ≤, ≥ ). Example: H0: μ = 3
Alternative Hypothesis (H1): Contains inequality ( ≠, <, > ). Example: H1: μ ≠ 3
Population Parameter: Hypotheses are always about population parameters, not sample statistics.


Hypothesis Testing Process
The process of hypothesis testing involves several steps, from formulating hypotheses to making a decision based on sample data.
State the null and alternative hypotheses.
Choose a significance level (α).
Collect sample data and calculate the test statistic.
Determine the rejection region or p-value.
Make a decision: reject or do not reject H0.
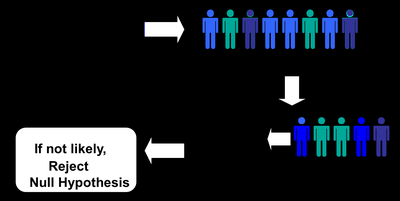
Reason for Rejecting the Null Hypothesis
The null hypothesis is rejected if the sample statistic falls in the rejection region, which is defined by the significance level.
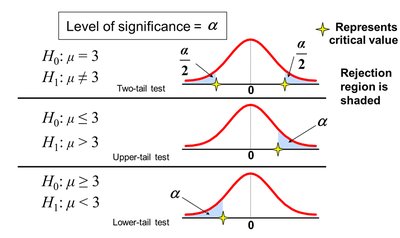
Level of Significance (α)
The level of significance, denoted by α, defines the threshold for rejecting the null hypothesis. It represents the probability of making a Type I error.
Typical values: 0.01, 0.05, 0.10
Rejection region: The area of the sampling distribution where H0 is rejected.
Errors in Hypothesis Testing
Two types of errors can occur in hypothesis testing:
Type I Error (α): Rejecting a true null hypothesis.
Type II Error (β): Failing to reject a false null hypothesis.
Relationship Between Type I and Type II Errors
Type I and Type II errors are inversely related. Increasing the probability of one decreases the probability of the other. They cannot occur simultaneously.
Type I error occurs only if H0 is true.
Type II error occurs only if H0 is false.
Factors affecting β: difference between hypothesized and true value, α, σ, and sample size n.
Power of the Test
The power of a test is the probability of correctly rejecting a false null hypothesis. It increases with larger sample sizes.
Power = 1 - β
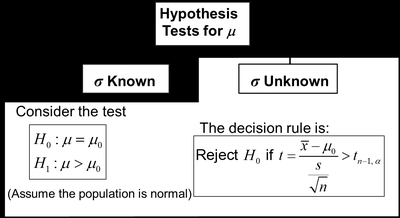
Hypothesis Tests for the Mean
Tests of the Mean of a Normal Distribution (σ Known)
When the population standard deviation (σ) is known, the z-test is used to test hypotheses about the population mean.
Convert sample mean (x̄) to a z value:
p-Value Approach
The p-value is the probability of obtaining a test statistic as extreme as the observed value, assuming H0 is true. It is compared to α to make a decision.
If p-value < α, reject H0.
If p-value ≥ α, do not reject H0.
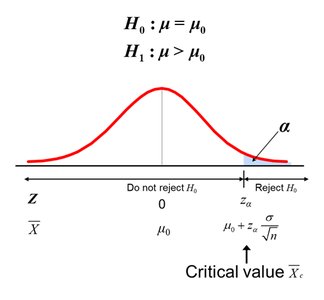
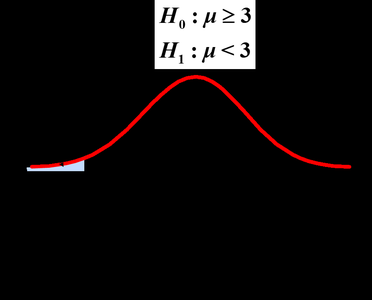
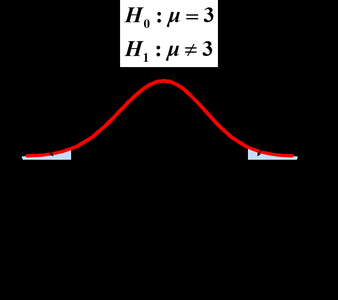
One-Tail and Two-Tail Tests
Depending on the alternative hypothesis, tests can be one-tailed (upper or lower) or two-tailed.
Upper-tail test: H1: μ > μ0
Lower-tail test: H1: μ < μ0
Two-tail test: H1: μ ≠ μ0
Example: Two-Tail Z Test (σ Known)
Suppose we want to test if the mean number of TV sets in US homes is equal to 3, with σ = 0.8, n = 100, and α = 0.05. The test statistic is:
Critical values: ±1.96
Since z = -2.0 < -1.96, reject H0


Example: p-Value Calculation
For z = -2.0, the p-value is:
Since p-value = 0.0456 < α = 0.05, reject H0
Tests of the Mean of a Normal Population (σ Unknown)
t-Test for Mean (σ Unknown)
When the population standard deviation is unknown, the t-test is used. The test statistic is:
Critical values are based on the t-distribution with n-1 degrees of freedom.
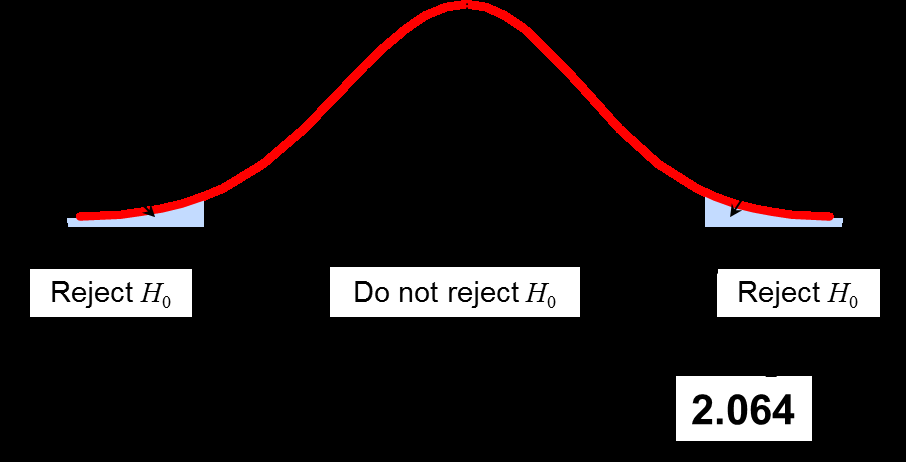
Example: Two-Tail t-Test (σ Unknown)
Suppose the average cost of a hotel room in Chicago is said to be $168. A sample of 25 hotels yields x̄ = $172.50, s = $15.40, α = 0.05.
Test statistic:
Critical value: t24, .025 = ±2.064
Since t = 1.46 is not in the rejection region, do not reject H0
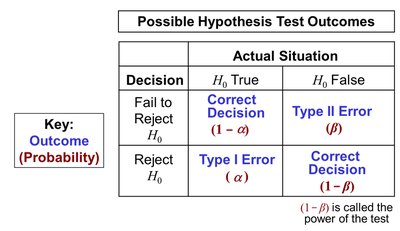
Summary Table: Hypothesis Test Outcomes
The following table summarizes the possible outcomes and associated probabilities in hypothesis testing:
Decision | H0 True | H0 False |
|---|---|---|
Fail to Reject H0 | Correct Decision (1 - α) | Type II Error (β) |
Reject H0 | Type I Error (α) | Correct Decision (1 - β) |
Additional info: (1 - β) is called the power of the test.
