 Back
BackHypothesis Testing, t-Distribution, and Regression Analysis: Structured Study Notes
Study Guide - Smart Notes
 Tailored notes based on your materials, expanded with key definitions, examples, and context.
Hypothesis Testing
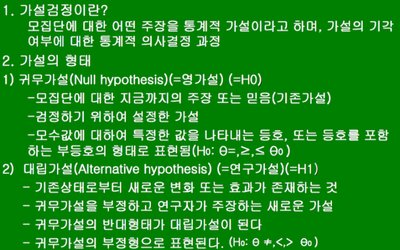
Definition and Process
Hypothesis testing is a statistical process used to evaluate claims about a population parameter based on sample data. It involves formulating hypotheses and determining whether to reject the null hypothesis based on statistical evidence.
Null Hypothesis (H0): The default assumption or claim about the population parameter, often representing no effect or no difference.
Alternative Hypothesis (H1): The claim that contradicts the null hypothesis, representing the presence of an effect or difference.
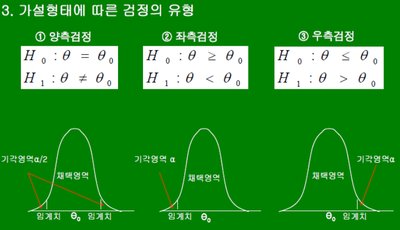
Types of Hypothesis Tests
The form of the hypothesis determines the type of test:
Two-sided (Bilateral) Test: Tests for any difference (H0: θ = θ0, H1: θ ≠ θ0).
Left-sided (Lower-tail) Test: Tests for a decrease (H0: θ ≥ θ0, H1: θ < θ0).
Right-sided (Upper-tail) Test: Tests for an increase (H0: θ ≤ θ0, H1: θ > θ0).
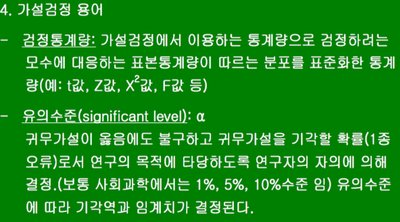
Key Terms in Hypothesis Testing
Test Statistic: A standardized value calculated from sample data, used to decide whether to reject H0. Examples include t, Z, χ2, and F statistics.
Significance Level (α): The probability of rejecting H0 when it is true (Type I error). Common values are 0.01, 0.05, and 0.10.
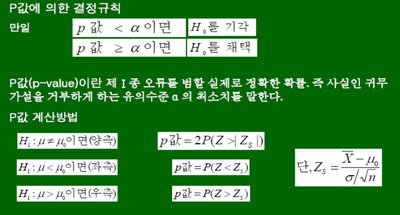
Decision Rule Using p-value
The p-value is the probability of observing a test statistic as extreme as, or more extreme than, the observed value under H0. The decision rule is:
If p-value < α, reject H0.
If p-value ≥ α, do not reject H0.
Calculation of p-value depends on the test type:
For two-sided tests:
For left-sided tests:
For right-sided tests:
Where
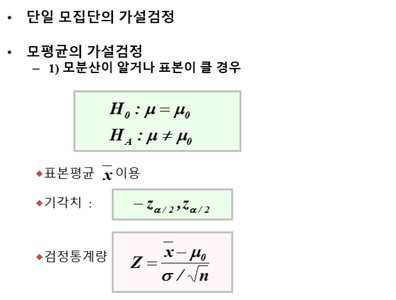
One-Sample Mean Hypothesis Test
When testing the mean of a single population:
If population variance is known or sample size is large, use Z-test:
Test statistic:
Critical values:
t-Distribution and Its Application
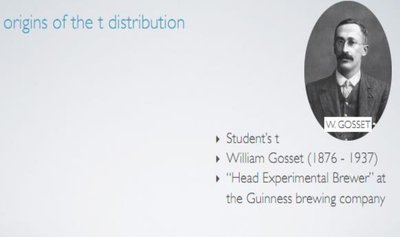
Origins and Properties
The t-distribution was developed by William Gosset ("Student") for small sample inference when population variance is unknown. It is symmetric and bell-shaped, but has heavier tails than the normal distribution.

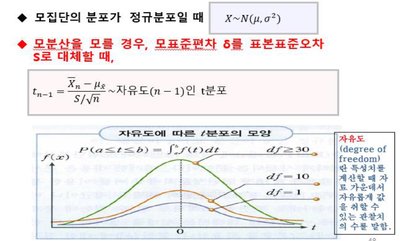
t-Test for Small Samples
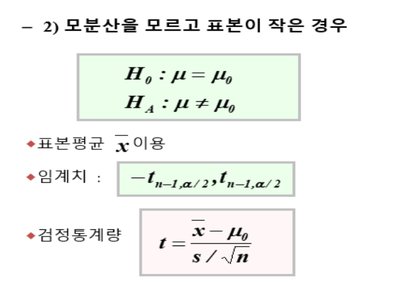
When population variance is unknown and sample size is small, use the t-test:
Test statistic:
Degrees of freedom:
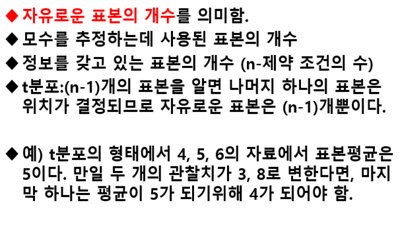
Degrees of Freedom
Degrees of freedom represent the number of independent values in a sample that can vary. For a sample of size n, the degrees of freedom for estimating variance is n-1.
Example: In a sample of 4, 5, 6, the mean is 5. If two values change, the last must adjust to keep the mean at 5.
t-Test for Unknown Variance
When population variance is unknown and sample size is small:
Test statistic:
Critical values:
Regression Analysis
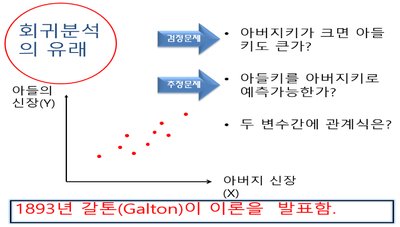
Historical Context and Concept
Regression analysis studies the relationship between a dependent variable and one or more independent variables. It was first formalized by Galton in 1893, examining the relationship between parent and child heights.
Dependent variable (Y): The outcome being predicted.
Independent variable (X): The predictor or explanatory variable.
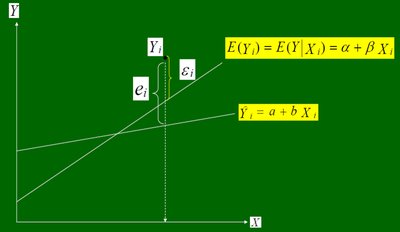
Regression Equation and Residuals
The regression equation models the expected value of Y given X:
Estimated regression line:
Residual:

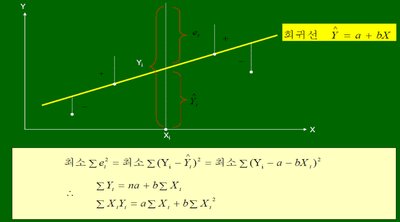
Least Squares Method
The least squares method estimates the regression line by minimizing the sum of squared residuals:
Normal equations for least squares:
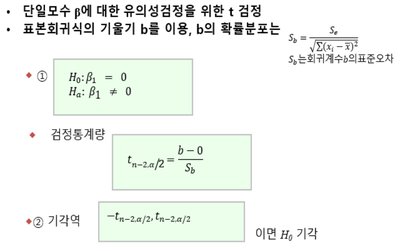
Testing Regression Coefficients: t and F Tests
To test the significance of regression coefficients:
t-test: Tests if the slope (β) is significantly different from zero.
Test statistic: , where is the standard error of the slope.
Critical values:

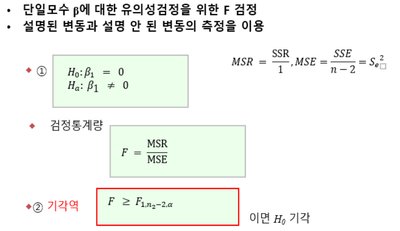
F-test: Compares explained variance to unexplained variance to test overall model significance.
Test statistic:
Critical value:
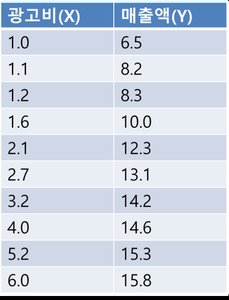
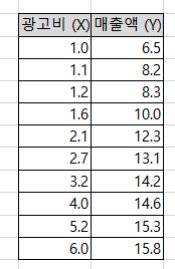
Regression Example: Advertising and Sales
Consider the relationship between advertising expenditure (X) and sales (Y):
광고비 (X) | 매출액 (Y) |
|---|---|
1.0 | 6.5 |
1.1 | 8.2 |
1.2 | 8.3 |
1.6 | 10.0 |
2.1 | 12.3 |
2.7 | 13.1 |
3.2 | 14.2 |
4.0 | 14.6 |
5.2 | 15.3 |
6.0 | 15.8 |
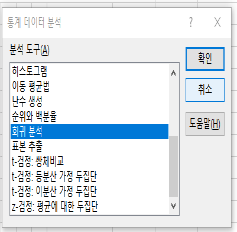
Regression Output Interpretation
Key statistics from regression analysis:
R-squared (결정계수): Proportion of variance in Y explained by X. Here, .
Standard error: Measures the average distance between observed and predicted values.
t-statistic and p-value: Used to test the significance of the slope.
F-statistic: Tests overall model significance.
Example Interpretation: The regression model explains 82.91% of the variance in sales. The slope is statistically significant (p-value < 0.05), indicating a meaningful relationship between advertising and sales.
*Additional info: The notes and images cover hypothesis testing, t-distribution, and regression analysis, all directly relevant to college-level statistics topics, including formulas, decision rules, and practical examples.*
