 Back
BackChapter 8- Hypothesis Testing with Two Samples: Independent and Dependent Samples, z-Tests, and t-Tests
Study Guide - Smart Notes
 Tailored notes based on your materials, expanded with key definitions, examples, and context.
Chapter 8: Hypothesis Testing with Two Samples
Understanding the Sampling Distribution of the Difference Between Two Means
When comparing two population means, it is essential to understand the sampling distribution of their difference. This distribution forms the basis for hypothesis testing, allowing us to determine whether observed differences are statistically significant or likely due to random variation.
Sampling Distribution: The distribution of differences between sample means, assuming repeated sampling from the populations.
Standard Error of the Difference: Measures the variability of the difference between sample means.
z vs. t: Use the z-distribution when population standard deviations are known; use the t-distribution when they are unknown and sample sizes are small.
Independent vs. Dependent Samples
Correctly classifying samples as independent or dependent is crucial, as it determines the appropriate statistical test and formula.
Independent Samples
Definition: Two samples are independent if knowing information about one sample provides no information about the other.
Characteristics: Samples are mutually exclusive; each subject is in only one group.
Examples:
Comparing treatment and control groups in an experiment.
Samples from different regions or populations.
First-year vs. second-year students.
Dependent Samples
Definition: Two samples are dependent if knowing information about one sample provides information about the other.
Characteristics: Samples are not mutually exclusive; often, the same subjects are measured twice or are matched pairs.
Examples:
Pre-test and post-test measurements on the same individuals.
Measurements within families (e.g., siblings).
Matched pairs (e.g., matched case-control studies).
Why it matters: The formulas for hypothesis testing differ for independent and dependent samples to account for the presence or absence of relationships between observations. Using the wrong formula increases the risk of decision errors.

Two-Sample z-Test for the Difference Between Means
The two-sample z-test is used to compare the means of two independent populations when the population standard deviations are known.
Assumptions:
Population standard deviations (\( \sigma_1, \sigma_2 \)) are known.
Samples are randomly selected and independent.
Populations are normally distributed or sample sizes are large (\( n \geq 30 \)).
Test Statistic Formula:
Where:
\( \overline{x}_1, \overline{x}_2 \): Sample means
\( \mu_1, \mu_2 \): Population means (often, \( \mu_1 - \mu_2 = 0 \) under the null hypothesis)
\( \sigma_1, \sigma_2 \): Population standard deviations
\( n_1, n_2 \): Sample sizes
Example: Testing whether mean credit card debts differ between Oklahoma and North Carolina.
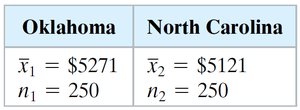
Suppose \( \sigma_1 = 960 \), \( \sigma_2 = 845 \), \( \overline{x}_1 = 5271 \), \( \overline{x}_2 = 5121 \), \( n_1 = n_2 = 250 \). The z-test can be applied to determine if the difference is statistically significant at \( \alpha = 0.05 \).
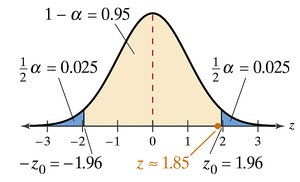
If the calculated z-value does not fall in the rejection region, we fail to reject the null hypothesis.
Two-Sample t-Test for the Difference Between Means
When population standard deviations are unknown, the two-sample t-test is used. This test was developed by William Sealy Gosset ("Student") while working at Guinness Brewery.

Assumptions:
Population variances are unknown.
Samples are random and independent.
Populations are normally distributed or both sample sizes are at least 30.
Test Statistic Formula (Equal Variances):
Where the pooled variance \( s_p^2 \) is:
Degrees of Freedom: \( d.f. = n_1 + n_2 - 2 \)
Test Statistic Formula (Unequal Variances):
Degrees of Freedom: Use the smaller of \( n_1 - 1 \) or \( n_2 - 1 \).
Example: Comparing two teaching methods for fire safety using a right-tailed hypothesis test.
Calculate pooled variance, standard error, and t-value.
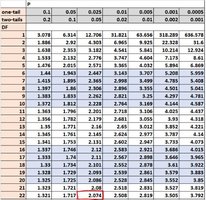
Compare the calculated t to the critical value from the t-table.
Dependent Samples t-Test (Paired Samples t-Test)
When samples are related (e.g., pre-test/post-test, matched pairs), the dependent samples t-test is used. This test accounts for the covariance between paired observations, reducing the standard error and increasing statistical power.
Difference Scores: For each pair, compute the difference \( d = x_1 - x_2 \).
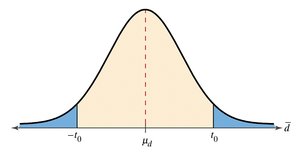
Test Statistic Formula:
\( \overline{d} \): Mean of the differences
\( \mu_d \): Hypothesized mean difference (often 0)
\( s_d \): Standard deviation of the differences
\( n \): Number of pairs
\( d.f. = n - 1 \)
Example: Measuring improvement in Canadian History knowledge before and after instruction in the same group of immigrants.
Summary Table: Independent vs. Dependent Samples t-Tests
Feature | Independent Samples t-Test | Dependent Samples t-Test |
|---|---|---|
Sample Relationship | Unrelated (mutually exclusive) | Related (paired or repeated measures) |
Test Statistic | ||
Standard Error | Pooled or separate variance formula | Standard deviation of difference scores |
Degrees of Freedom | (or smaller of ) | |
Example | Treatment vs. control group | Pre-test vs. post-test in same group |
Key Points to Remember
Correctly classify samples as independent or dependent before choosing a test.
Use the z-test when population variances are known and sample sizes are large; otherwise, use the t-test.
For dependent samples, analyze difference scores to account for within-pair correlation.
Always check assumptions (normality, independence, equal variances) before applying tests.
