 Back
BackHypothesis Testing with Two Samples: Independent and Dependent Samples, z-Tests, and t-Tests
Study Guide - Smart Notes
 Tailored notes based on your materials, expanded with key definitions, examples, and context.
Chapter 8: Hypothesis Testing with Two Samples
Understanding the Sampling Distribution of the Difference Between Two Means
When comparing two population means, it is essential to understand the sampling distribution of their difference. This distribution allows us to make inferences about whether observed differences are statistically significant or likely due to random variation.
Sampling Distribution: The probability distribution of the difference between two sample means, assuming random sampling from each population.
Standard Error: The standard deviation of the sampling distribution of the difference between means, which quantifies the expected variability in mean differences due to sampling error.
Independent vs. Dependent Samples
It is crucial to distinguish between independent and dependent samples, as the statistical tests and formulas differ for each scenario.
Independent Samples
Samples are independent if knowing information about one sample provides no information about the other.
Examples: Different groups assigned to treatment or control, samples from different regions, or different grade levels.
Dependent Samples
Samples are dependent if there is a relationship between them, such as repeated measurements on the same subjects or matched pairs.
Examples: Pre- and post-treatment measurements on the same individuals, siblings, or matched pairs in experiments.
Applying the correct formula is essential to avoid decision errors in hypothesis testing.

Classifying Sample Pairs
Example 1: Triglyceride levels before and after treatment in the same patients → Dependent
Example 2: Scores for males vs. females on a test → Independent
Two-Sample z-Test for the Difference Between Means
The two-sample z-test is used when comparing the means of two independent samples, provided the population standard deviations are known and other assumptions are met.
Population standard deviations (σ) are known.
Samples are randomly selected and independent.
Populations are normally distributed or sample sizes are large (n ≥ 30).
Formula for the z-test:
Where:
= sample means
= population means (often assumed equal under H0)
= population standard deviations
= sample sizes
Example: Comparing Credit Card Debts
A watchdog group claims a difference in mean credit card debts between Oklahoma and North Carolina. Data from random samples (n = 250 each) are:
Oklahoma | North Carolina |
|---|---|
n_1 = 250 | n_2 = 250 |
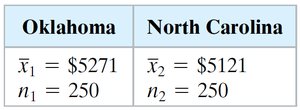
Assume and . Using , the z-test is performed. The critical values are for a two-tailed test.
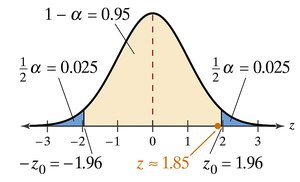
Since the calculated z is not in the rejection region, we fail to reject the null hypothesis. There is not enough evidence at the 5% significance level to support the claim of a difference in mean debts.
Switching to t: The t-Test for the Difference Between Means
When population standard deviations are unknown, the t-test is used. This test was developed by William Sealy Gosset ("Student") while working at Guinness Brewery, leading to the famous Student's t-distribution.


Used when and are unknown.
Samples are random and independent.
Populations are normally distributed or both sample sizes are at least 30.
Formula for the t-test (equal variances):
Where is the pooled variance estimate:
Degrees of freedom:
If variances are not equal, use:
Degrees of freedom: smaller of or
Example: Comparing Teaching Methods
Method 1: Traditional
Method 2: New (with technology)
Right-tailed test (claim: new method is superior)
Calculate pooled variance, standard error, and t-statistic
The logic is to compare the observed mean difference to what would be expected under the null hypothesis, using the t-distribution to determine significance.
t vs. z
z-test: Used when population parameters are known or sample size is very large.
t-test: Used with sample data and unknown population parameters; t-distribution is flatter with thicker tails for small samples.
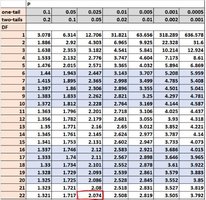
t-Table
The t-table provides critical values for various degrees of freedom and significance levels.
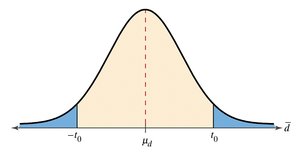
Dependent Samples t-Test (Paired Samples t-Test)
When samples are related (e.g., pre-post designs, matched pairs), the paired samples t-test is used. This test analyzes the differences within pairs rather than treating the samples as independent.
Calculate the difference for each pair:
Compute the mean and standard deviation of the differences
Test statistic:
Where:
= mean of the differences
= standard deviation of the differences
= number of pairs
Degrees of freedom:
Applications of Dependent Samples t-Test
Pre- and post-test designs
Matched pairs (e.g., siblings, matched controls)
Longitudinal studies (same individuals measured over time)
Summary Table: Independent vs. Dependent Samples
Independent Samples | Dependent Samples |
|---|---|
Different individuals in each group e.g., treatment vs. control | Same or matched individuals e.g., pre-post, matched pairs |
Use two-sample z or t-test | Use paired samples t-test |
Assume no relationship between samples | Assume relationship between samples |
Additional info: The choice of test depends on the study design and whether the samples are independent or related. Always check assumptions before applying these tests.
