 Back
BackInference for a Difference in Means: Two-Sample T Procedures
Study Guide - Smart Notes
 Tailored notes based on your materials, expanded with key definitions, examples, and context.
Inference for Quantitative Data: Difference in Means
Sampling Distribution of a Difference in Means
The sampling distribution of the difference in means is fundamental for comparing two independent groups. It describes the distribution of the statistic \( \bar{x}_1 - \bar{x}_2 \) across repeated samples.
Shape: The distribution is approximately normal if both sample sizes are large (\( n_1 \geq 30 \) and \( n_2 \geq 30 \)), or if the populations are normal when sample sizes are smaller.
Center: The mean of the sampling distribution is \( \mu_1 - \mu_2 \).
Spread: The standard error measures the spread and is calculated using sample standard deviations.
Conditions:
Samples must be independent.
Random selection or random assignment is required.
If sample sizes are small, populations should be approximately normal.
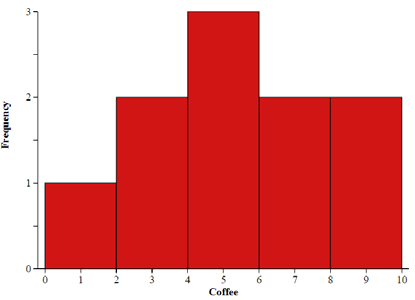
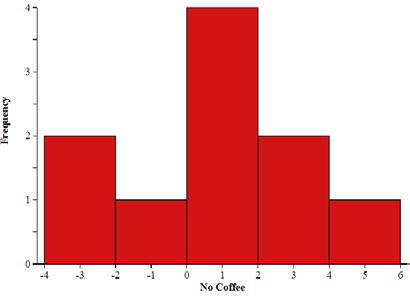
Example: The histograms above show the distribution of percent changes in polyphenol levels for coffee and no coffee groups, supporting the assumption of approximate normality.
Standard Error for Difference in Means
The standard error is used when population standard deviations are unknown, and is calculated from sample data:
Formula:
Estimated Standard Deviation: The standard error is also referred to as the estimated standard deviation of the sampling distribution.
Degrees of Freedom for Two-Sample T Procedures
Degrees of freedom (df) are required for determining the critical value in t-distributions. There are two main methods:
Option 1 (Exact): This rarely yields a whole number and is often calculated by software or calculators.
Option 2 (Conservative): Use the smaller of \( n_1 - 1 \) and \( n_2 - 1 \). This method is more conservative, resulting in wider confidence intervals and higher p-values.
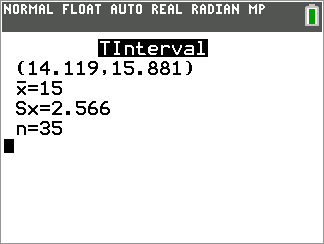
Two-Sample T Interval for a Difference in Means
Constructing a Confidence Interval
When conditions are met, an approximate C% confidence interval for \( \mu_1 - \mu_2 \) is:
Formula: where \( t^* \) is the critical value from the t-distribution with appropriate degrees of freedom.
Interpretation: The interval estimates the range in which the true difference in means lies with C% confidence.
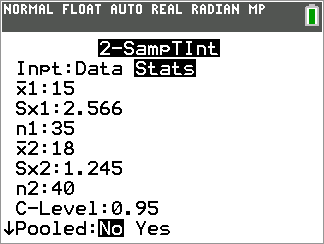
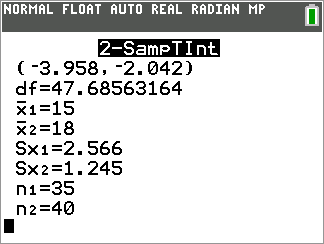
Example: In a study comparing coffee drinkers and non-coffee drinkers, a 90% confidence interval for the difference in mean percent changes in polyphenol levels was constructed. The interval was entirely above zero, suggesting coffee is more effective at producing polyphenols.
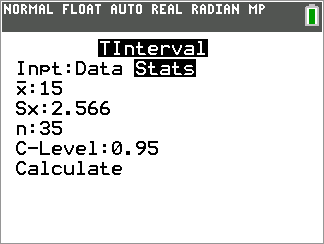
Calculator Steps for Two-Sample T Interval
Input sample means, standard deviations, sample sizes, and confidence level.
Use the calculator function 2-SampTInt to compute the interval.
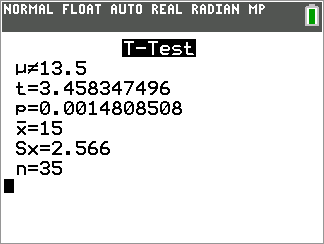
Two-Sample T-Test for a Difference in Means
Hypothesis Testing
The two-sample t-test is used to test whether the means of two independent groups are equal.
Null Hypothesis:
Alternative Hypothesis: (or one-sided)
Test Statistic:
P-value: Calculated using the t-distribution with appropriate degrees of freedom.
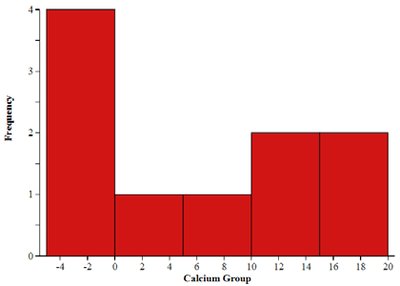
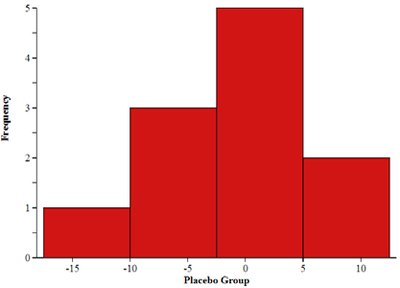
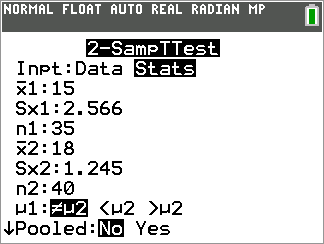
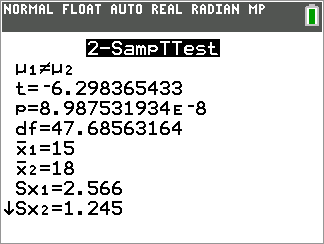
Example: In a randomized experiment, the decrease in systolic blood pressure was compared between a calcium supplement group and a placebo group. The p-value was greater than 0.05, so the null hypothesis was not rejected, indicating no convincing evidence that calcium reduces blood pressure more than placebo.
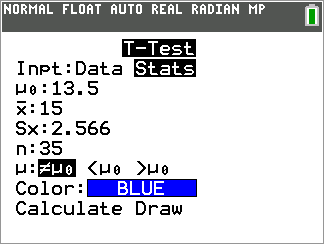
Calculator Steps for Two-Sample T-Test
Input sample means, standard deviations, sample sizes, and specify the alternative hypothesis.
Use the calculator function 2-SampTTest to compute the test statistic and p-value.
Calculator Summary Table
The table below summarizes the main calculator functions for inference with means:
Inference Method | Calculator Function |
|---|---|
One Sample T Interval for Means | 8: Tinterval |
Two Sample T Interval for Means | 0: 2-SampTInt |
One Sample T Test for Means | 2: T-Test |
Two Sample T Test for Means | 4: 2-SampTTest |
Summary of Key Concepts
Two-sample t procedures are used to compare means from two independent groups.
Conditions include independence, randomization, and normality (or large sample sizes).
Standard error and degrees of freedom are essential for calculations.
Confidence intervals estimate the difference in means; hypothesis tests assess evidence for a difference.
Calculator functions streamline computations for both intervals and tests.
Additional info:
Histograms are used to visually assess normality and the presence of outliers or skewness in sample data.
Random assignment in experiments helps ensure independence and validity of inference.
