 Back
BackInference for a Population Proportion: Confidence Intervals and Hypothesis Testing
Study Guide - Smart Notes
 Tailored notes based on your materials, expanded with key definitions, examples, and context.
Inference for a Population Proportion
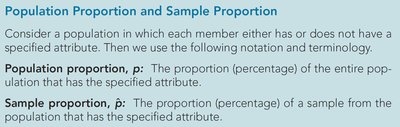
Population Proportion and Sample Proportion
In statistics, we often wish to estimate or test the proportion of a population that possesses a certain attribute. This is fundamental in survey analysis, quality control, and many other fields.
Population proportion, p: The proportion (percentage) of the entire population that has the specified attribute.
Sample proportion, \hat{p}: The proportion (percentage) of a sample from the population that has the specified attribute.
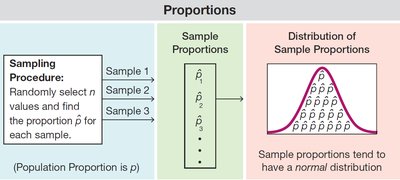
Sampling Distribution of the Sample Proportion
When we repeatedly take random samples of size n from a population and calculate the sample proportion \hat{p} for each, the distribution of these sample proportions forms the sampling distribution of \hat{p}. For large enough sample sizes, this distribution is approximately normal due to the Central Limit Theorem.
Mean: p
Standard deviation:
Normal approximation: Valid when both and .
Confidence Intervals for a Population Proportion
A confidence interval (CI) provides a range of plausible values for the population proportion p based on the sample data. The most common method is the one-proportion z-interval.
Margin of error, E: The maximum likely difference between the sample proportion and the true population proportion at a given confidence level.
Formula for CI:
Interpretation: We are (1-α)% confident that the true population proportion lies within this interval.

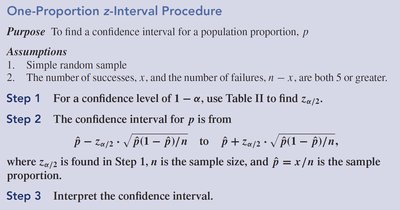
One-Proportion z-Interval Procedure
To construct a confidence interval for a population proportion, follow these steps:
For a confidence level of 1 − α, use a z-table to find .
Compute the confidence interval: to .
Interpret the confidence interval in the context of the problem.
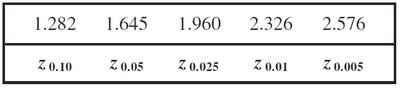
Common z-Values for Confidence Intervals
The value of depends on the desired confidence level:
z0.10 | z0.05 | z0.025 | z0.01 | z0.005 |
|---|---|---|---|---|
1.282 | 1.645 | 1.960 | 2.326 | 2.576 |
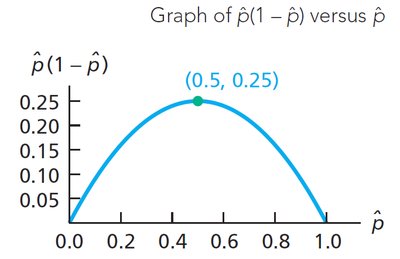
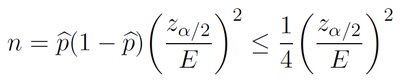
Determining Sample Size for a Desired Margin of Error
To achieve a specific margin of error E for a confidence interval, the required sample size n can be calculated as:
If no prior estimate for \hat{p} is available, use 0.5 for maximum variability.
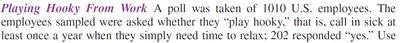
Example: Playing Hooky From Work
A poll of 1010 U.S. employees asked if they "play hooky" (call in sick at least once a year for relaxation). 202 responded "yes." This data can be used to construct a confidence interval for the proportion of employees who play hooky.
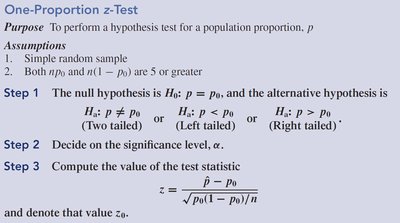
One-Proportion z-Test: Hypothesis Testing for a Population Proportion
Hypothesis testing allows us to assess claims about a population proportion. The one-proportion z-test is used when the sample size is large enough for the normal approximation to be valid.
Null hypothesis, H0: p = p0
Alternative hypothesis, Ha: p ≠ p0 (two-tailed), p < p0 (left-tailed), or p > p0 (right-tailed)
Test statistic:
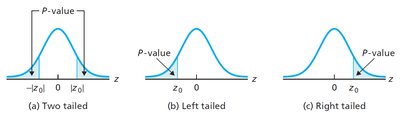
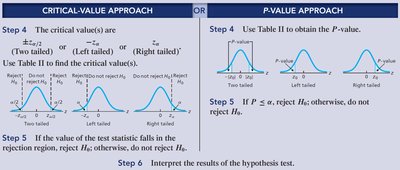
Critical-Value and P-Value Approaches
There are two main approaches to making a decision in hypothesis testing:
Critical-value approach: Compare the test statistic to critical values from the z-table. If the statistic falls in the rejection region, reject H0.
P-value approach: Find the probability (P-value) of observing a test statistic as extreme as, or more extreme than, the observed value. If P ≤ α, reject H0.
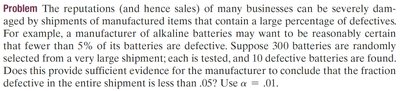
Example: Quality Control in Manufacturing
Suppose a manufacturer wants to ensure that fewer than 5% of batteries are defective. In a random sample of 300 batteries, 10 are found defective. We can use a one-proportion z-test to determine if there is sufficient evidence to conclude the defective rate is less than 0.05 at α = 0.01.
Summary Table: Key Formulas and Concepts
Concept | Formula | Notes |
|---|---|---|
Sample Proportion | x = number with attribute, n = sample size | |
Standard Error | Used in CI and z-test | |
Confidence Interval | 1-α confidence level | |
z-Test Statistic | Test H0: p = p0 | |
Sample Size for Margin E | Use \hat{p} = 0.5 if unknown |
