 Back
BackChapter 11: Inference on Two Population Parameters: Hypothesis Testing and Confidence Intervals
Study Guide - Smart Notes
 Tailored notes based on your materials, expanded with key definitions, examples, and context.
Inference on Two Population Parameters
Overview
This chapter covers statistical inference procedures for comparing two population parameters, including proportions, means, and standard deviations. The main focus is on hypothesis testing and confidence interval construction for independent and dependent samples.
Inference about Two Population Proportions
Hypothesis Testing for Two Proportions
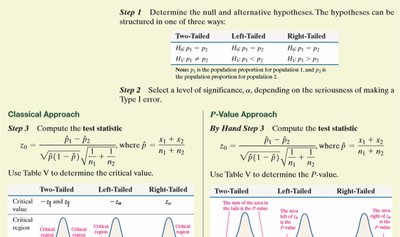
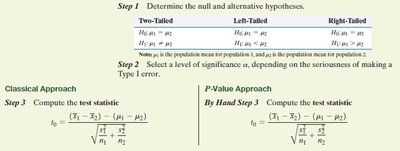
To compare two population proportions, we use independent samples and test hypotheses about their difference. The hypotheses can be structured as:
Two-Tailed: vs.
Left-Tailed: vs.
Right-Tailed: vs.
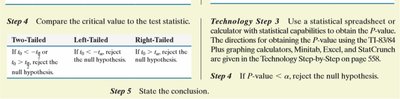
Step 1: State the null and alternative hypotheses.
Step 2: Select the significance level .
Step 3: Compute the test statistic: where is the pooled sample proportion.
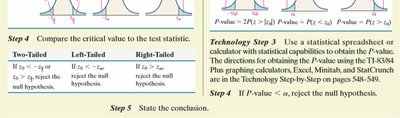
Step 4: Compare the test statistic to the critical value or use the P-value approach.
If (two-tailed), reject .
If (left-tailed), reject .
If (right-tailed), reject .
Step 5: State the conclusion.
Confidence Intervals for the Difference of Two Proportions
A confidence interval for is:
Lower bound:
Upper bound:
Inference about Two Means: Dependent Samples (Matched Pairs)
Hypothesis Testing for Matched-Pairs Data
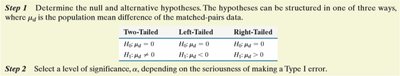
When data are paired (dependent samples), we analyze the differences between pairs. The hypotheses are:
Two-Tailed: vs.
Left-Tailed: vs.
Right-Tailed: vs.
Step 1: State the hypotheses.
Step 2: Select .
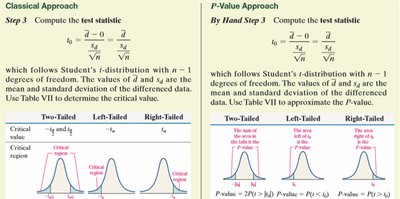
Step 3: Compute the test statistic: where is the mean of the differences, is the standard deviation of the differences, and is the number of pairs.
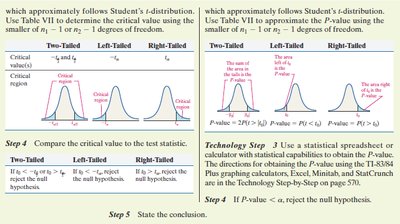
Step 4: Compare to the critical value from the -distribution with degrees of freedom, or use the P-value approach.
Step 5: State the conclusion.
Confidence Interval for the Mean Difference
The confidence interval for the mean difference is:
Lower bound:
Upper bound:
Inference about Two Means: Independent Samples
Hypothesis Testing for Two Independent Means
For independent samples, the hypotheses are:
Two-Tailed: vs.
Left-Tailed: vs.
Right-Tailed: vs.
Step 1: State the hypotheses.
Step 2: Select .
Step 3: Compute the test statistic (Welch's t):
Step 4: Compare to the critical value from the -distribution with the smaller of or degrees of freedom, or use the P-value approach.
Step 5: State the conclusion.
Confidence Interval for the Difference of Two Means
The confidence interval for is:
Lower bound:
Upper bound:
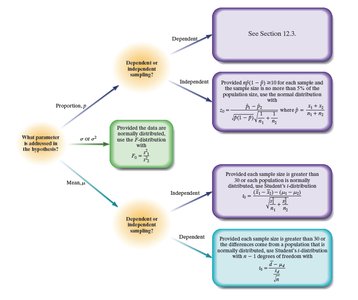
Choosing the Appropriate Inference Procedure
To determine the correct test, consider:
What parameter is addressed (proportion, mean, or standard deviation)?
Are the samples independent or dependent?
Are the population variances assumed equal or unequal?
Inference about Two Population Standard Deviations
F-Distribution and Hypothesis Testing
To compare two population standard deviations, use Fisher's F-distribution. The test statistic is:
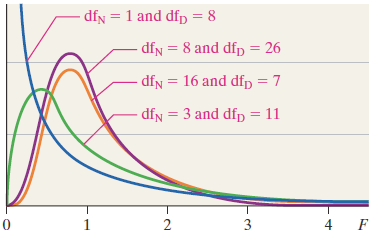
The F-distribution is right-skewed, and its shape depends on the degrees of freedom in the numerator and denominator.
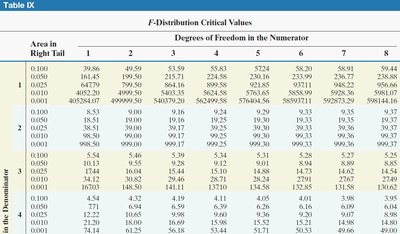
Critical Values and Table Lookup
Critical values for the F-distribution are found using statistical tables, based on the area in the right tail and the degrees of freedom.
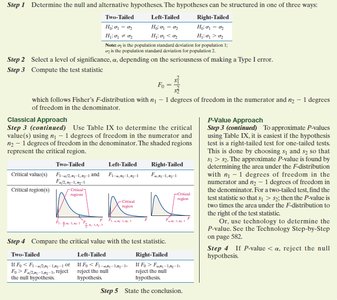
Steps for Hypothesis Testing with Two Standard Deviations
Step 1: State the hypotheses:
Two-Tailed: vs.
Left-Tailed: vs.
Right-Tailed: vs.
Step 2: Select .
Step 3: Compute and determine the critical value from the F-table.
Step 4: Compare to the critical value or use the P-value approach.
Step 5: State the conclusion.
Summary Table: Choosing the Correct Test
Use the following guidelines:
Two Proportions: Use the z-test for independent samples.
Two Means (Independent): Use Welch's t-test if variances are unequal.
Two Means (Dependent): Use the paired t-test.
Two Standard Deviations: Use the F-test.
Additional info: The images included above are directly relevant to the step-by-step procedures for hypothesis testing and confidence intervals, as well as the visual understanding of the F-distribution and the decision process for selecting the appropriate statistical test.
