Back
BackInference on Two Samples: Proportions, Means, and Standard Deviations
Study Guide - Smart Notes
 Tailored notes based on your materials, expanded with key definitions, examples, and context.
Inference about Two Population Proportions
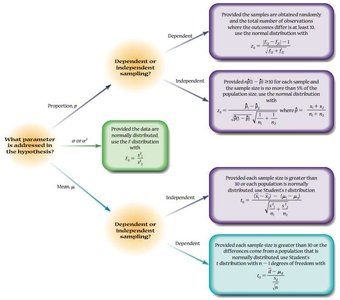
Distinguishing Between Independent and Dependent Sampling
When comparing two populations, it is essential to determine whether the samples are independent or dependent. Independent samples are those where the selection of individuals in one sample does not influence the selection in the other. Dependent samples (also called matched-pairs samples) occur when individuals in one sample are paired with individuals in the other sample, often based on some matching criterion.
Example of Dependent Sampling: Comparing hotel prices in the same towns for two hotel chains.
Example of Independent Sampling: Comparing weights of randomly selected state quarters and traditional quarters.
Testing Hypotheses Regarding Two Population Proportions (Independent Samples)
To test hypotheses about the difference between two population proportions, the following conditions must be met:
Samples are independently obtained using simple random sampling.
Sample sizes are large enough: and .
Each sample size is no more than 5% of the population size.
The sampling distribution of is approximately normal with mean and standard deviation:
The standardized test statistic is:
When testing , the pooled estimate is used:
The test statistic becomes:
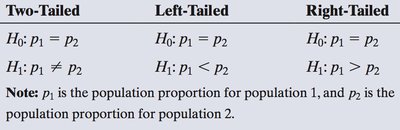
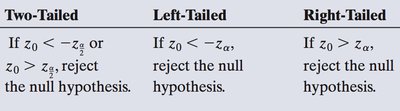
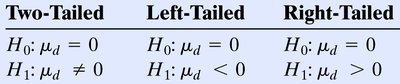
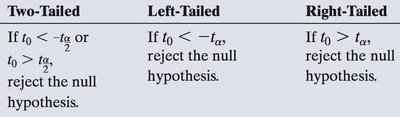
Formulating Hypotheses
Depending on the research question, hypotheses can be two-tailed, left-tailed, or right-tailed:
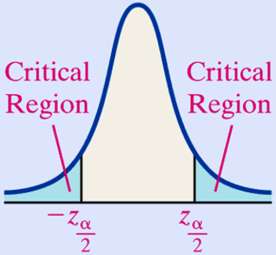
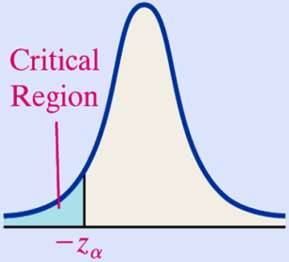
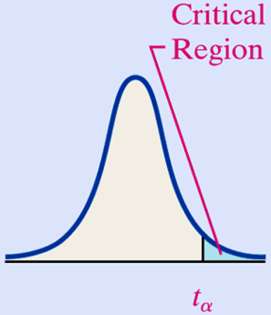
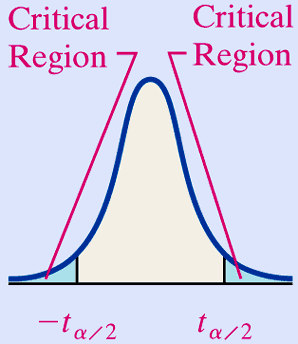
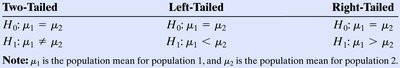
Critical Regions and Decision Rules
The critical region depends on the type of test:
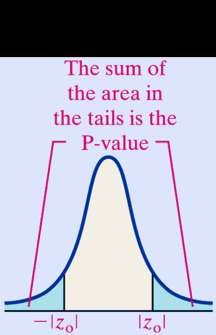
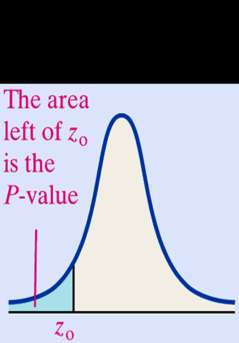
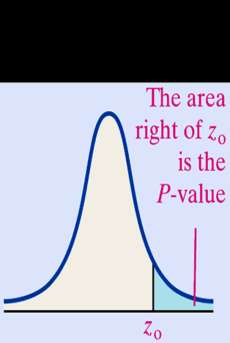
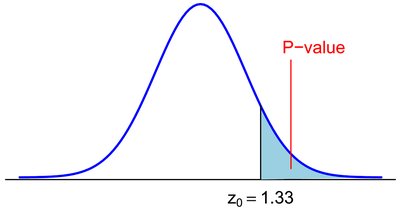
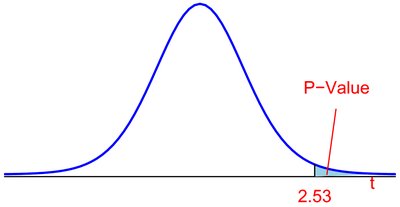
P-Value Approach
The P-value is the probability, under the null hypothesis, of obtaining a result as extreme or more extreme than the observed result. The sum of the areas in the tails corresponds to the P-value in a two-tailed test.
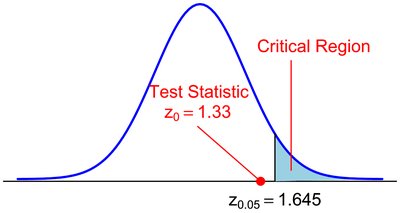
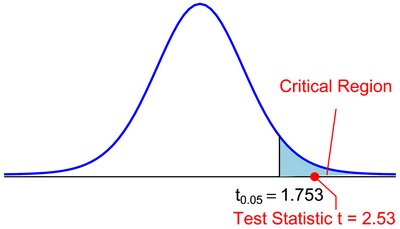
Example: Testing Proportions
Suppose an economist wants to test if the proportion of urban households with Internet access is greater than that of rural households. The test statistic and critical region are illustrated below:
Constructing and Interpreting Confidence Intervals for the Difference Between Two Proportions
A confidence interval for is given by:
If the interval contains 0, there is no significant difference between the proportions.
Testing Hypotheses Regarding Two Proportions from Dependent Samples (Matched Pairs)
When samples are dependent, such as in matched-pairs designs, McNemar’s Test is used. The data are arranged in a contingency table, and the test statistic is:
where and are the counts of discordant pairs.
Inference about Two Means: Dependent Samples (Matched Pairs)
Testing Hypotheses Regarding Matched-Pairs Data
For matched-pairs data, inference is performed on the differences. The test statistic is:
where is the mean of the differences and is the standard deviation of the differences. The hypotheses are:
Checking Assumptions
Normal probability plots and boxplots are used to check for normality and outliers in the differences.
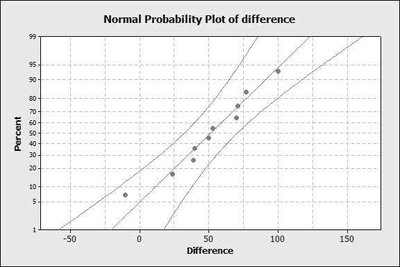
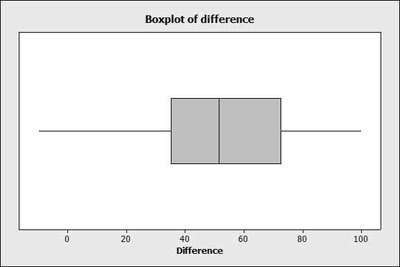
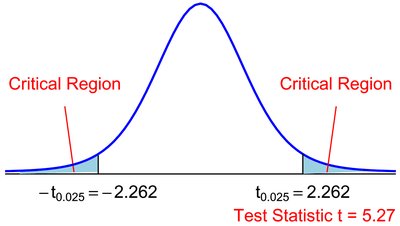
Example: Hotel Price Comparison
Suppose we compare hotel prices in 10 cities. The test statistic and critical regions are shown below:
Constructing Confidence Intervals for the Population Mean Difference
A confidence interval for is:
Inference about Two Means: Independent Samples
Testing Hypotheses Regarding the Difference of Two Independent Means
For independent samples, the test statistic is:
The hypotheses are:

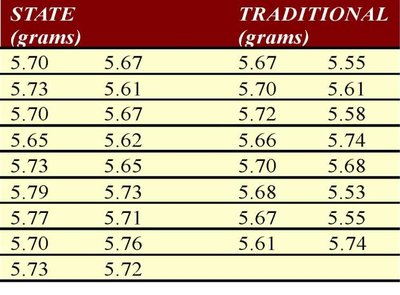
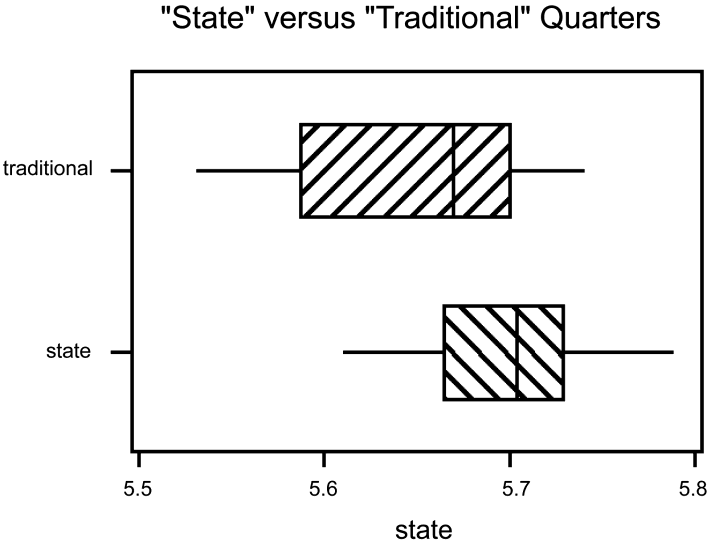
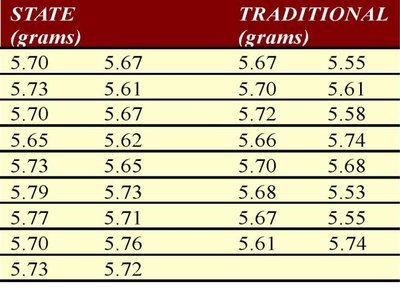
Example: State vs. Traditional Quarters
Suppose we compare the weights of state and traditional quarters. The data and boxplot are shown below:
Constructing Confidence Intervals for the Difference of Two Means
A confidence interval for is:
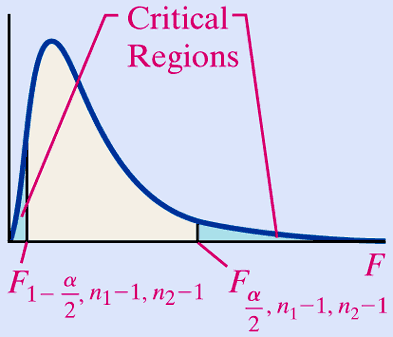
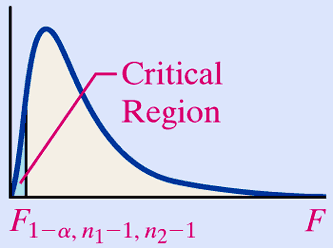
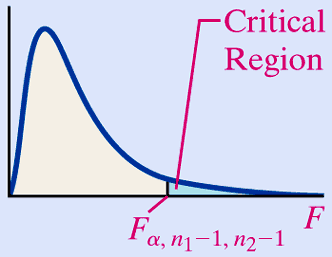
Inference about Two Population Standard Deviations
Testing Hypotheses Regarding Two Population Standard Deviations
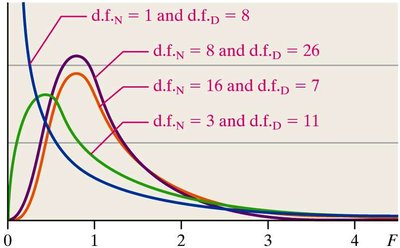
To compare two population standard deviations, the F-test is used. The test statistic is:
The F-distribution is not symmetric and is skewed right. The critical regions for two-tailed, left-tailed, and right-tailed tests are illustrated below:
Example: Comparing Standard Deviations of Quarters
Suppose we compare the standard deviations of state and traditional quarters. The data are shown below:
Summary: Choosing the Appropriate Inference Method
The choice of statistical test depends on the parameter of interest (proportion, mean, or standard deviation) and whether the samples are independent or dependent. The following flowchart summarizes the decision process: