 Back
BackInferences from Two Samples: Proportions and Means
Study Guide - Smart Notes
 Tailored notes based on your materials, expanded with key definitions, examples, and context.
Inferences from Two Samples
Overview
This chapter explores statistical methods for comparing two populations using sample data. The focus is on hypothesis testing and confidence interval estimation for differences between two proportions, two means (independent samples), and two means (dependent/matched pairs). These methods are foundational for making inferences about population parameters based on sample evidence.
Inferences About Two Proportions
Key Concepts and Objectives
Hypothesis Test: Test a claim about two population proportions.
Confidence Interval: Construct a confidence interval estimate for the difference between two population proportions.
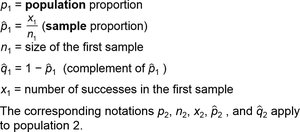
Notation for Two Proportions
p1: Population proportion for group 1
\( \hat{p}_1 = \frac{x_1}{n_1} \): Sample proportion for group 1
n1: Size of the first sample
\( \hat{q}_1 = 1 - \hat{p}_1 \): Complement of the sample proportion
x1: Number of successes in the first sample
Corresponding notations apply for population 2.
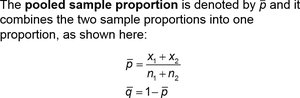
Pooled Sample Proportion
The pooled sample proportion combines the two sample proportions into one estimate:
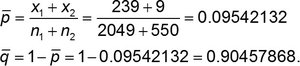
\( \bar{p} = \frac{x_1 + x_2}{n_1 + n_2} \)
\( \bar{q} = 1 - \bar{p} \)
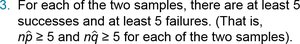
Requirements for Inference
Samples must be simple random samples.
Samples must be independent (no natural pairing between groups).
Each sample must have at least 5 successes and 5 failures: \( n\hat{p} \geq 5 \) and \( n\hat{q} \geq 5 \) for both samples.
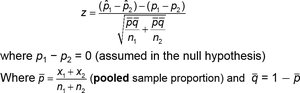
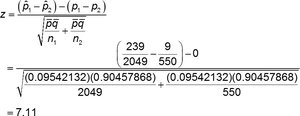
Test Statistic for Two Proportions
To test the null hypothesis \( H_0: p_1 = p_2 \), use the following z-test statistic:
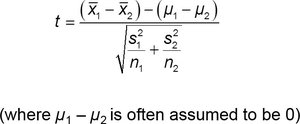
Where \( p_1 - p_2 = 0 \) under the null hypothesis.
Confidence Interval for Difference of Proportions
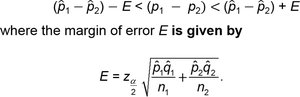
The confidence interval for \( p_1 - p_2 \) is:
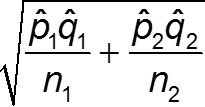
Where the margin of error \( E \) is:
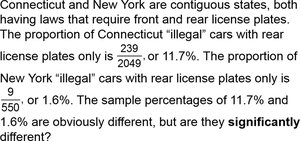
Example: Comparing Proportions of Cars with Rear License Plates Only
Suppose we want to test whether the proportion of cars with rear license plates only is the same in Connecticut and New York.
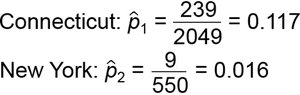
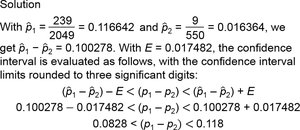
Connecticut: \( \hat{p}_1 = \frac{239}{2049} = 0.117 \)
New York: \( \hat{p}_2 = \frac{9}{550} = 0.016 \)
Step-by-Step Solution
State hypotheses: ,
Significance level:
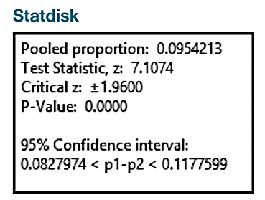
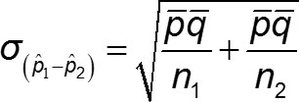
Calculate pooled proportion:
Calculate test statistic:
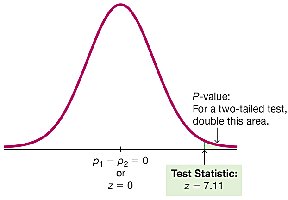
Interpretation
P-value is much less than 0.05, so we reject .
There is sufficient evidence to conclude that the proportions are different.
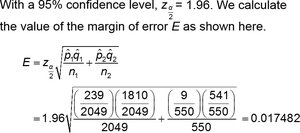
Confidence Interval Example
Construct a 95% confidence interval for :
Margin of error:
Confidence interval: or
Theoretical Foundation
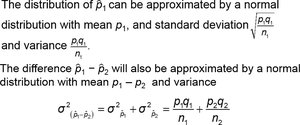
The sampling distribution of is approximately normal with mean and variance .
The variance of the difference is .
Inferences About Two Means: Independent Samples
Key Concepts and Objectives
Hypothesis Test: Test a claim about two independent population means.
Confidence Interval: Construct a confidence interval estimate for the difference between two independent population means.
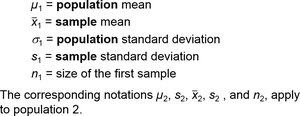
Notation for Two Means
\( \mu_1 \): Population mean for group 1
\( \bar{x}_1 \): Sample mean for group 1
\( \sigma_1, s_1 \): Population and sample standard deviation for group 1
\( n_1 \): Sample size for group 1
Corresponding notations apply for group 2.
Test Statistic for Two Means (Independent Samples)
When population standard deviations are unknown and not assumed equal, use the following t-test statistic:
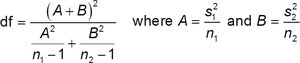
Degrees of freedom (df) can be approximated by:
, where and
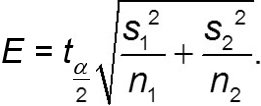
Confidence Interval for Difference of Means
The confidence interval for is:
Example: Are Male Professors and Female Professors Rated Differently?
Student course evaluation scores for courses taught by female and male professors are compared using a two-sample t-test.
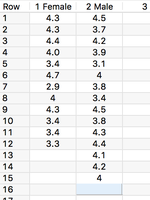
Hypotheses: ,
Significance level:
Test statistic: (calculated from sample data)
P-value: 0.5172 (greater than 0.05)
Conclusion: Fail to reject ; no significant difference in mean scores.
Confidence Interval Example
95% confidence interval for :
Since the interval contains 0, there is no significant difference between the means.
Summary Table: Key Formulas
Parameter | Test Statistic | Confidence Interval |
|---|---|---|
Two Proportions | ||
Two Means (independent, unknown variances) |
Additional info: These methods are essential for comparing groups in experimental and observational studies, especially in health and biological sciences. Technology (such as statistical software) is commonly used to perform these calculations and obtain P-values.
