 Back
BackInferences from Two Samples: Proportions, Means, and Matched Pairs
Study Guide - Smart Notes
 Tailored notes based on your materials, expanded with key definitions, examples, and context.
Section 9-1: Inferences About Two Proportions
Testing Claims About Two Population Proportions
This section covers methods for testing claims about the difference between two population proportions and constructing confidence intervals for that difference. The null hypothesis is always p1 = p2, while the alternative hypothesis can be p1 ≠ p2, p1 > p2, or p1 < p2. The main goal is to determine if the observed difference p1 - p2 is statistically significant.
Test Statistic: The 2-PropZTest is used to test hypotheses about two proportions.
Confidence Interval: The 2-PropZInt is used to estimate the difference between two proportions.
Interpreting the Interval:
If both interval endpoints are positive, p1 is likely greater than p2.
If both are negative, p2 is likely greater than p1.
If the interval contains zero, there is minimal difference between the proportions.
Example: Bednets to Reduce Malaria
Scenario: Compare malaria incidence in infants using bednets (15/343) vs. not using bednets (27/294).
Hypotheses:
H0: p1 = p2
H1: p1 < p2 (incidence is lower with bednets)
Significance Level: 0.01
Analysis: Use the P-value and Critical Value methods to draw conclusions. Also, construct a confidence interval to check if it supports the test result.
Example: Fast Food Drive-Through Accuracy
Scenario: Compare order accuracy at Burger King (264/318) and McDonald's (329/362).
Hypotheses:
H0: p1 = p2
H1: p1 ≠ p2
Significance Level: 0.05
Analysis: Use both the P-value and Critical Value methods, and construct a confidence interval for the difference.
Example: Dreaming in Black and White
Scenario: Compare the proportion of people over 55 (68/306) and under 25 (13/298) who dream in black and white.
Hypotheses:
H0: p1 = p2
H1: p1 > p2
Significance Level: 0.01
Analysis: Use the P-value and Critical Value methods, and construct a confidence interval for the difference.
Confidence Levels for Hypothesis Tests
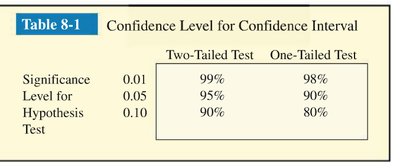
The confidence level for a confidence interval depends on the significance level and whether the test is one-tailed or two-tailed. The table below summarizes the relationship:
Significance Level | Two-Tailed Test | One-Tailed Test |
|---|---|---|
0.01 | 99% | 98% |
0.05 | 95% | 90% |
0.10 | 90% | 80% |
Section 9-2: Inferences About Two Means
Testing Claims About Two Population Means
This section discusses methods for comparing the means of two independent populations. The process is similar to that for proportions, but uses the 2-SampTTest for hypothesis testing and 2-SampTInt for confidence intervals. The interval is written as μ1 - μ2.
Test Statistic: Use the 2-SampTTest for hypothesis testing.
Confidence Interval: Use the 2-SampTInt to estimate the difference between means.
Degrees of Freedom (df): For two samples, df is provided by the calculator/test output.
Interpreting the Interval:
If both endpoints are positive, μ1 > μ2.
If both are negative, μ2 > μ1.
If the interval contains zero, there is minimal difference between the means.
Example: Do Men Talk Less Than Women?
Scenario: Compare the mean number of words spoken per day by men (n=186, x̄=15668.5, s=8632.5) and women (n=210, x̄=16215, s=7301.2).
Hypotheses:
H0: μ1 = μ2
H1: μ1 < μ2
Significance Level: 0.01
Analysis: Use the P-value and Critical Value methods, and construct a confidence interval for the difference.
Example: Longevity of Popes and Monarchs
Scenario: Compare the mean years lived after election/coronation for British monarchs and popes.
Hypotheses:
H0: μ1 = μ2
H1: μ1 < μ2 or μ1 > μ2
Significance Level: 0.01
Analysis: Use the P-value and Critical Value methods, and construct a confidence interval for the difference.
Example: Color and Cognition
Scenario: Compare word recall scores for red (n=35, x̄=15.89, s=5.90) and blue (n=36, x̄=12.31, s=5.48) backgrounds.
Hypotheses:
H0: μ1 = μ2
H1: μ1 ≠ μ2
Significance Level: 0.05
Analysis: Use the P-value and Critical Value methods, and construct a confidence interval for the difference.
Section 9-3: Matched Pairs
Testing Differences in Matched Pairs
Matched pairs involve dependent samples, where each observation in one sample is paired with a related observation in the other. The analysis focuses on the differences between pairs, using the T-test for hypothesis testing and TInterval for confidence intervals. The interval is written as μd (mean difference).
Test Statistic: Use the T-test for the mean of the differences.
Confidence Interval: Use the TInterval for the mean difference.
Example: Compare taxi-out and taxi-in times for the same flights. Calculate the difference for each pair and analyze the mean difference.
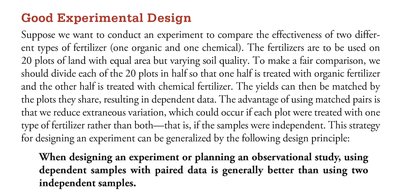
Good Experimental Design
When designing experiments or observational studies, using dependent samples with paired data is generally better than using two independent samples. This approach reduces extraneous variation and allows for more accurate comparisons.
Key Formulas
Test Statistic for Two Proportions: where
Confidence Interval for Two Proportions:
Test Statistic for Two Means (Independent Samples):
Confidence Interval for Two Means:
Test Statistic for Matched Pairs: where is the mean of the differences and is the standard deviation of the differences.
Confidence Interval for Matched Pairs:
