 Back
BackInferring Population Means and Comparing Groups: Confidence Intervals, Hypothesis Tests, and Variance Analysis
Study Guide - Smart Notes
 Tailored notes based on your materials, expanded with key definitions, examples, and context.
Confidence Intervals for Population Means
Introduction to Confidence Intervals
Confidence intervals are used to estimate population parameters by providing a range of plausible values, rather than a single point estimate. The confidence level represents the probability that the interval contains the true parameter.
Point Estimate: The best single estimate of a parameter (e.g., sample mean).
Confidence Interval: A range of values likely to contain the parameter, often written as .
Confidence Level: The probability (e.g., 95%) that the interval contains the parameter. Notation: .
Margin of Error: The distance between the point estimate and the bounds of the interval.
Example:
For a 95% confidence interval with point estimate and margin of error , the interval is .
Critical Values and Calculating Margin of Error
Critical values (z-scores or t-scores) are used to calculate the margin of error. The total area in the tails of a confidence interval is .
Critical Value: or , depending on whether the population standard deviation is known.
Margin of Error Formula (z):
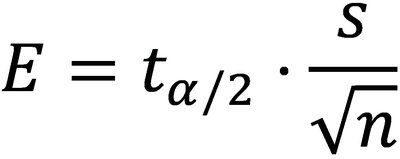
Margin of Error Formula (t):
Table: Common Critical Values
Confidence Level | z-value |
|---|---|
90% | 1.645 |
95% | 1.960 |
99% | 2.576 |
Population Standard Deviation Known vs. Unknown
When the population standard deviation () is known, use the z-distribution. When unknown, use the t-distribution with sample standard deviation () and degrees of freedom ().
z-distribution: Used when is known and sample size or population is normal.
t-distribution: Used when is unknown, sample size or population is normal.
Example:
Construct a 99% confidence interval for a mean travel time with sample mean hour, minutes, .
Using TI-84 Calculator for Confidence Intervals
TI-84 calculators can compute confidence intervals using ZInterval or TInterval functions. Enter sample statistics or raw data, specify confidence level, and select the appropriate function.
ZInterval: Use when is known.
TInterval: Use when is unknown.

Minimum Sample Size for Confidence Intervals
Determining Sample Size
To achieve a desired margin of error, rearrange the margin of error formula to solve for sample size .
Sample Size Formula:
Range Rule of Thumb: Estimate as if not given.

Comparing Two Proportions
Hypothesis Tests for Two Proportions
To test claims about the difference between two proportions, use a pooled sample proportion and calculate the z-score.
Null Hypothesis:
Test Statistic:
Pooled Proportion:
Confidence Intervals for Two Proportions
Construct a confidence interval for the difference in proportions using individual sample proportions.
Margin of Error:
Interval:
Comparing Two Means
Hypothesis Tests for Two Means (Unknown, Unequal Variances)
When comparing means from two independent samples with unknown and unequal variances, use the t-distribution.
Null Hypothesis:
Test Statistic:
Degrees of Freedom:
Confidence Intervals for Two Means
Construct a confidence interval for the difference in means using the t-distribution.
Margin of Error:
Interval:
Matched Pairs (Dependent Samples)
Introduction to Matched Pairs
Matched pairs occur when two data sets are related, and each value in one set is paired with a value in the other set. Common relationships include before-and-after measurements or related individuals.
Difference Calculation: for each pair.
Mean Difference:
Standard Deviation of Differences:
Hypothesis Tests and Confidence Intervals for Matched Pairs
Replace the sample mean with the mean difference and use the t-distribution for hypothesis tests and confidence intervals.
Test Statistic:
Confidence Interval: where
Hypothesis Test for Correlation Coefficient
Testing the Significance of Correlation
The correlation coefficient () measures the strength and direction of a linear relationship. Hypothesis tests can determine if the correlation is statistically significant.
Null Hypothesis: (no correlation)
Alternative Hypothesis: (correlation exists)
Test Statistic: Use LinRegTTest on TI-84.

F-Distribution and Two Variances
Introduction to F-Distribution
The F-distribution is used to compare two variances. It is always right-skewed and takes only positive values. The F-statistic is calculated as the ratio of two sample variances.
Null Hypothesis:
Test Statistic:
Degrees of Freedom: ,
Hypothesis Tests for Two Variances Using TI-84
Use the 2-SampFTest function on TI-84 to perform hypothesis tests for two variances.

Summary Table: Key Formulas
Concept | Formula |
|---|---|
Margin of Error (z) | |
Margin of Error (t) | |
Sample Size | |
Range Rule of Thumb | |
Degrees of Freedom |

Additional info: These notes expand on the original content by providing definitions, formulas, and examples for each major topic, ensuring completeness and academic quality for exam preparation.
