 Back
Interpreting Graphs and Choosing Appropriate Visualizations in Introductory Statistics
Study Guide - Smart Notes
 Tailored notes based on your materials, expanded with key definitions, examples, and context.
Interpreting Graphs in Statistics
Choosing Appropriate Graphs for Data Types
In statistics, the type of data you are analyzing determines the most suitable graphical representation. Selecting the correct graph is essential for accurately conveying information and avoiding misinterpretation.
Numerical Data: Data that consists of numbers and can be measured or ordered (e.g., heights, weights, test scores).
Categorical Data: Data that can be sorted into categories or groups (e.g., colors, brands, types of ice cream).
Common Graph Types:
Bar Graphs: Used for categorical data to compare frequencies or counts across categories.
Histograms: Used for numerical data to show the distribution of values in intervals (bins).
Pie Charts: Used for categorical data to show proportions of a whole.
Dotplots and Boxplots: Used for numerical data to display distributions and identify outliers.
Examples of Graph Selection
Consider the following bar charts comparing violent crimes over several years. The choice of scale and bar width can affect interpretation.
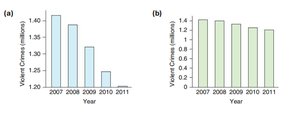
Key Point: Always check axis scales and labels to avoid misleading conclusions.
Describing Data with Tables and Graphs
Tabular Data: Comparing Groups
Tables are useful for organizing raw data, especially when comparing groups. For example, the table below shows student-to-teacher ratios for private and public colleges.
Private Colleges | Public Colleges |
|---|---|
10, 17, 12, 12, 12, 30, 11, ... | 16, 21, 13, 18, 20, 19, 19, ... |
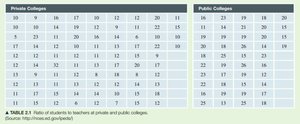
Purpose: This table allows for direct comparison of ratios between private and public institutions.
Visualizing Distributions: Histograms
Histograms are ideal for displaying the distribution of numerical data, such as student-to-teacher ratios. They show how frequently values fall within specified intervals.
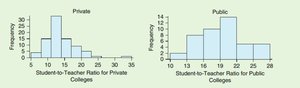
Private Colleges: Ratios are generally lower, indicating smaller class sizes.
Public Colleges: Ratios are higher, suggesting larger class sizes.
Example: Comparing the two histograms helps answer questions about differences in educational environments between private and public colleges.
Identifying Graph Types and Improving Visualizations
Bar Graph vs. Histogram
It is important to distinguish between bar graphs and histograms:
Bar Graph: Used for categorical data; bars are separated.
Histogram: Used for numerical data; bars touch to indicate continuous intervals.
Example: The following graph shows the distribution of houses with and without garages (0 = no garage, 1 = garage). Although it looks like a histogram, it is more appropriate as a bar graph because the data is categorical (garage or no garage).
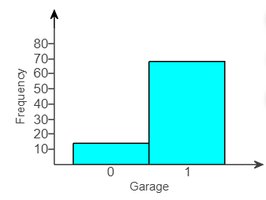
Improvement: Use a bar graph with separated bars and clear category labels.
Choosing the Right Graph for Ordinal Data
Ordinal data, such as self-perceived body image (1 = underweight, 2 = about right, 3 = overweight), can be tricky. While a histogram may be used, a bar graph is often better for displaying frequencies of ordered categories.
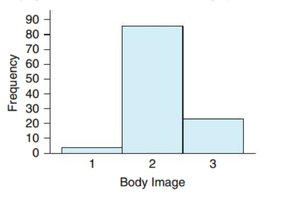
Recommendation: Use a bar graph for clarity, as the categories are discrete and ordered.
Applications and Case Studies
Case Study: Comparing Colleges
To determine if private 4-year schools are "better" than public ones, one measure is the student-to-teacher ratio (numerical data). Data from the 2010-2011 academic year for 89 private and 49 public colleges can be analyzed using tables and histograms (see above).
Analysis: Histograms reveal that private colleges tend to have lower student-to-teacher ratios, which may indicate more individualized attention.
Conclusion: The choice of measure and graph type is crucial for meaningful comparisons.
Practice Examples
Garage Example: The graph for garage presence is a bar graph (categorical data). It could be improved by separating the bars and labeling categories clearly.
Body Image Example: For ordinal data like body image, a bar graph is preferable to a histogram for clarity.
Hours of Sleep: For numerical data such as hours of sleep, a histogram or boxplot would best display the distribution among students.
Ice Cream Flavor Survey: For categorical preferences (chocolate, vanilla, strawberry), a bar graph or pie chart is appropriate. Low variability would be shown if one flavor dominates the responses.
Internet Browser Market Share: Pie charts are suitable for showing proportions, but clarity depends on the number of categories and differences in size.
Interpreting Comparative Graphs
Comparing Groups with Bar Charts
Bar charts can be used to compare distributions across groups, such as the percentage of renters and homeowners in various income brackets.
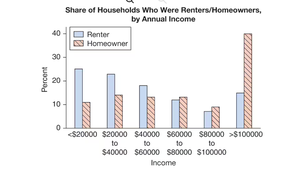
Variables: Housing status (categorical: renter/homeowner) and income bracket (categorical or ordinal).
Graph Type: Bar chart (not histogram).
Alternative: If actual income values were available, a histogram would be appropriate.
Interpretation: The graph shows that renters are more common in lower income brackets, while homeowners dominate higher income brackets.
Summary Table: Graph Types and Data Types
Data Type | Best Graph(s) | Example |
|---|---|---|
Categorical | Bar Graph, Pie Chart | Ice cream flavors, garage presence |
Numerical (Discrete or Continuous) | Histogram, Boxplot, Dotplot | Student-to-teacher ratio, hours of sleep |
Ordinal | Bar Graph | Body image categories |
Additional info: Always match the graph type to the data type for accurate and effective data presentation.
