 Back
BackIntroduction to Data and Statistical Thinking
Study Guide - Smart Notes
 Tailored notes based on your materials, expanded with key definitions, examples, and context.
Introduction to Statistics and Data
What is Statistics?
Statistics is the science of collecting, organizing, summarizing, and analyzing data to answer questions and draw conclusions. It is essential for making informed decisions and understanding patterns in the world around us.
Variation: Refers to differences or changes in items or observations.
Data: Observations gathered to draw conclusions, which can include measurements (e.g., weight, height), counts, or categories.
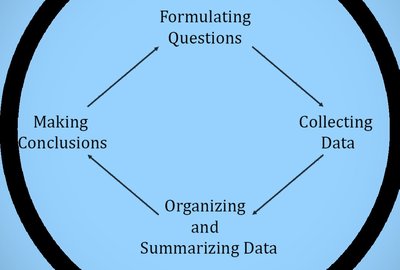
Key Steps in Statistical Investigation:
Formulating Questions
Collecting Data
Organizing and Summarizing Data
Making Conclusions
Classifying and Storing Data
Populations and Samples
A population is the entire group of individuals or objects of interest, while a sample is a subset of the population used to make inferences about the whole.
Population: The complete set being studied.
Sample: A representative subset of the population.
To interpret data meaningfully, context is crucial. The "Six W's" help provide this context:
Who: Individuals measured
What: Variables measured
When: Time of data collection
Where: Location of data collection
Why: Purpose of the study
How: Method of data collection
Types of Variables
Numerical (Quantitative) Variables: Describe quantities and are measured with units (e.g., age, weight).
Categorical (Qualitative) Variables: Describe qualities or categories (e.g., gender, color).
Examples:
Age (Numerical)
Gender (Categorical)
GPA (Numerical)
Major (Categorical)
Storing Data: Stacked vs. Unstacked
Data can be stored in different formats:
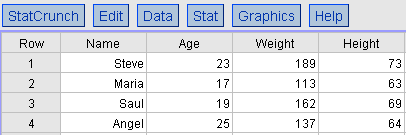
Stacked Data: Each row contains all variables for one individual; columns represent variables.
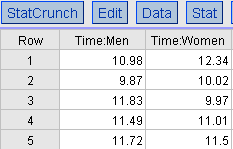
Unstacked Data: Each column represents a variable for a different group; typically used for comparing two groups.
Organizing Categorical Data
Frequency and Relative Frequency Tables
Organizing data helps reveal patterns and makes interpretation easier.
Frequency Table: Lists each category and the number of occurrences (counts).
Relative Frequency Table: Lists each category and the percentage of occurrences.
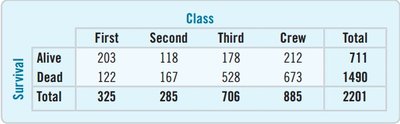
Two-Way Tables
Two-way tables display the relationship between two categorical variables, showing how individuals are distributed across combinations of categories.
Each cell shows the count for a combination of values.
Rates and Percentages
Why Use Rates?
Rates (such as percentages or counts per 1,000) allow for fair comparisons between groups of different sizes. For example, comparing the number of injuries per 1,000 players in different sports gives a better sense of risk than raw counts.
Rate Formula: (where is a scaling factor, e.g., 1,000 or 10,000)
Collecting Data to Understand Causality
Causality and Study Design
To determine if one variable causes changes in another, researchers use different study designs:
Treatment Variable: The variable manipulated by the researcher.
Outcome (Response) Variable: The variable measured for change.
Treatment Group: Receives the treatment.
Control Group: Does not receive the treatment.
Types of Studies:
Controlled Experiment: Participants are randomly assigned to groups; only this design can establish causation.
Observational Study: Groups are pre-existing; can show association but not causation.
Random Assignment and Bias
Random Assignment: Ensures groups are similar except for the treatment, minimizing bias.
Bias: Systematic error due to non-random assignment or other flaws in study design.
Confounding Variables
A confounding variable is an outside factor that affects both the treatment and outcome, making it difficult to determine causality.
Placebo Effect and Blinding
Placebo: A fake treatment used to control for psychological effects.
Single-Blind Study: Participants do not know their group assignment.
Double-Blind Study: Neither participants nor researchers know group assignments, reducing bias.
Gold Standard for Experiments
Large sample size
Randomized and controlled
Double-blind
Use of placebo (if appropriate)
Example: Effects of Light on Mice
Fifty mice were randomly assigned to two groups: 12 hours light/12 hours dark (LD) and 24 hours light (LL). The number of mice developing tumors was recorded.
LD | LL | |
|---|---|---|
Tumors | 4 | 14 |
No tumors | 46 | 36 |
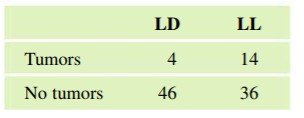
This is a controlled experiment because the assignment was random. The higher tumor rate in the LL group suggests a possible causal effect, but further studies are needed to confirm.
Association vs. Causation
Association between two variables does not imply that one causes the other. Confounding variables or coincidence may explain the relationship.
Anecdotal Evidence: Personal stories are not reliable for establishing scientific conclusions.
Summary Table: Types of Variables
Variable | Type |
|---|---|
Age | Numerical |
Gender | Categorical |
GPA | Numerical |
Major | Categorical |
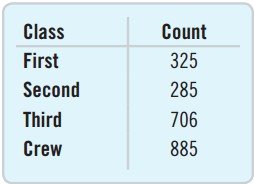
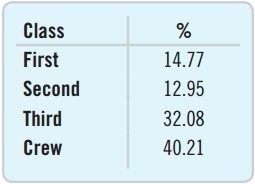
Summary Table: Frequency and Relative Frequency
Class | Count | % |
|---|---|---|
First | 325 | 14.77 |
Second | 285 | 12.95 |
Third | 706 | 32.08 |
Crew | 885 | 40.21 |
References: De Veaux et al., Devore, Gould et al., Larsen & Marx, Navidi & Monk.
