 Back
Introduction to Data and Visualizing Data in Statistics
Study Guide - Smart Notes
 Tailored notes based on your materials, expanded with key definitions, examples, and context.
Introduction to Statistics and Data
What is Statistics?
Statistics is the science of collecting, organizing, summarizing, and analyzing data to answer questions and draw conclusions. It is widely used in various fields such as biology, exercise science, social sciences, and business.
Data: Observations gathered to draw conclusions. Examples include the weight of children in kilograms or the percentage of honey bee wintering losses in a province.
Variation: Differences or changes in an item or variable. Variation is a fundamental concept in statistics, as it helps us understand the diversity and patterns within data.
Variables
A variable is a characteristic of people or things that can take on different values from individual to individual.
Examples: Weight of a newborn baby, price of a litre of gas, ground-level ozone concentration in the air.
The value of a variable can change from one individual to another.
Population vs. Sample
Understanding the difference between a population and a sample is crucial in statistics.
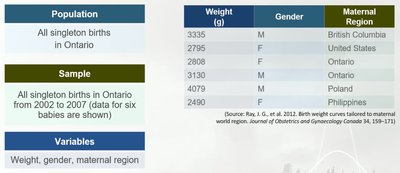
Population: The collection of all possible data values for the variable of interest. Gathering data from the entire population is often difficult, time-consuming, and costly.
Sample: A subset of the population. Information is easier and less costly to collect from a sample. Inferential statistics allow us to learn about the population by studying the sample.
Data Collection Context
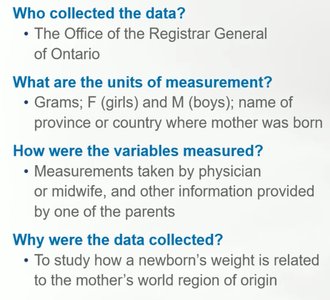
Who collected the data? The Office of the Registrar General of Ontario.
Units of measurement: Grams (weight), F (girls) and M (boys) for gender, and the name of the province or country for maternal region.
How were variables measured? Measurements taken by physician or midwife; other information provided by a parent.
Purpose: To study how a newborn’s weight is related to the mother’s world region of origin.
Classifying Variables and Data
Types of Variables
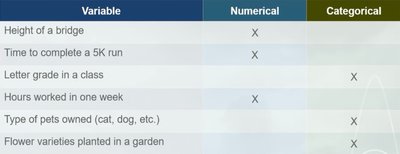
Numerical Variables: Describe a quantity or measurement. Values are numbers (e.g., temperature, salary, number of kittens in a litter).
Categorical Variables: Describe qualities or categories (e.g., eye color, diabetes status, level of agreement with a statement). Values are categories, such as Yes or No.
Coding Categorical Data
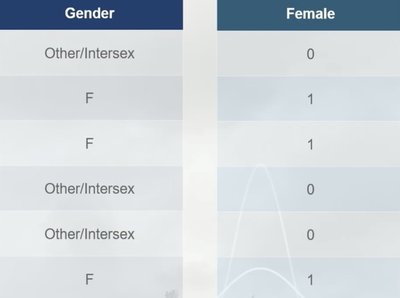
Categorical data can be coded using numbers to make data storage and analysis easier. For example, gender may be coded as 1 for female and 0 for not female. These numbers do not represent quantities.
Stacked vs. Unstacked Data
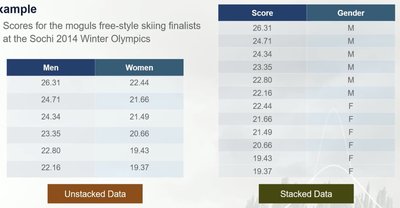
Stacked Data: Data values are stored in a spreadsheet format where each row contains data for a single individual and can store many variables.
Unstacked Data: Data values are stored in two or more columns, each representing a variable from a group. Can only store data for two variables.
Organizing and Displaying Data
Why Organize Data?
Organizing data helps us see patterns and make sense of the information. Displaying data visually is not always straightforward but is essential for analysis.
Two-Way Tables
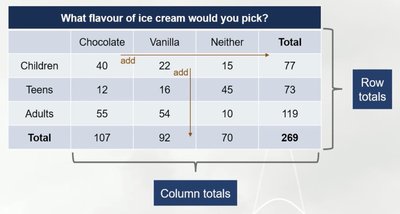
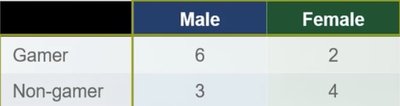
Two-way tables are a common way to organize categorical data, displaying results from two potentially related categorical variables and showing the frequency of each combination.
Comparing Data: Counts vs. Percentages
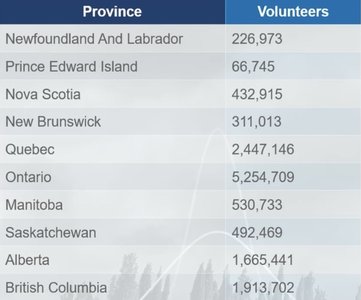
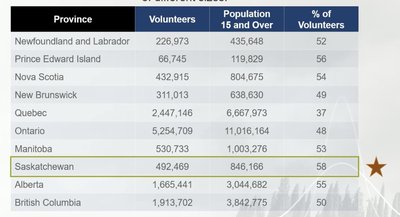
Percentages or rates are better than counts for making comparisons between groups of different sizes. For example, to compare volunteer rates across provinces, it is important to consider the population size.
Studying Causality and Experimental Design
Treatment and Outcome Variables
Treatment Variable: Whether or not a specific treatment is used.
Outcome Variable: The response to changes in the treatment.
Goal: To determine whether changes in the treatment variable cause changes in the outcome variable.
Methods for Collecting Data
Anecdotal Evidence: Based on personal stories or experiences; not reliable for drawing scientific conclusions.
Observational Study: Subjects are placed in groups by choice or circumstances not controlled by the researcher. Can establish relationships but not causality.
Controlled Experiment: Researchers assign subjects to treatment and control groups, allowing for causal inference if well-designed.
Correlation vs. Causation
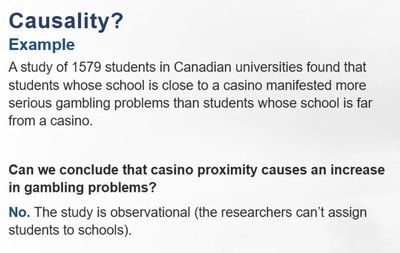
Only well-designed controlled experiments can establish causality. Observational studies can only show associations, not cause-and-effect relationships.
Confounding Variables
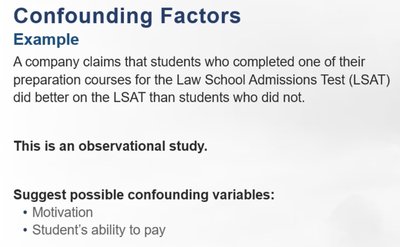
A confounding variable is an alternative explanation for observed differences between groups. It cannot be ruled out in observational studies.
Gold Standard for Experiments
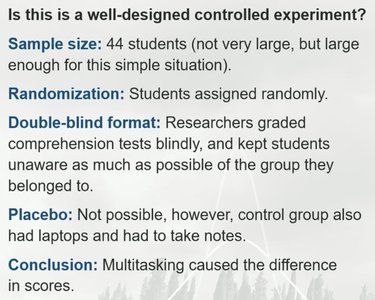
Large sample size to account for variability
Random assignment to treatment or control group to minimize bias
Use of placebo if appropriate
Double-blind study design to avoid bias
Case Study: Multitasking in the Classroom
An experiment with 44 university students showed that multitasking students scored 11% lower on comprehension tests than the control group. The study used randomization and blind grading, supporting a causal conclusion.

Describing Data with Tables and Graphs
What is a Distribution?
A distribution records all observed values (numbers or categories) and their frequencies. Graphs help visualize patterns in the data.
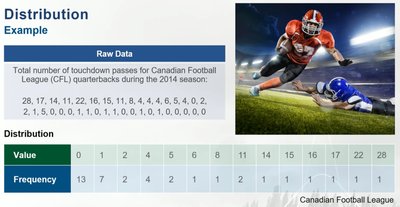
Dotplots
Each observation is represented by a dot on a number line. Dotplots are most useful for small data sets.
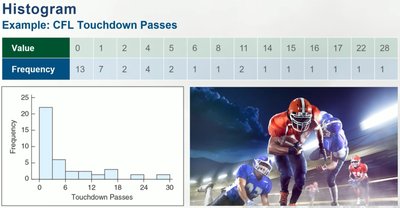
Histograms
Observations are grouped into intervals (bins), and each bin is represented by a vertical bar. The height of the bar is proportional to the frequency of observations in that bin.
Changing the bin width changes the appearance of the histogram. Thinner bins give more detail; wider bins give less.
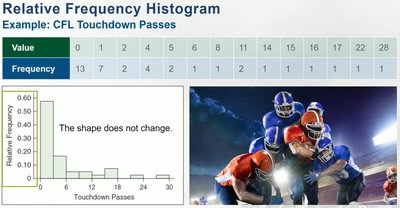
Relative frequency histograms show the proportion of observations in each bin. The shape does not change compared to the frequency histogram.
Stemplots
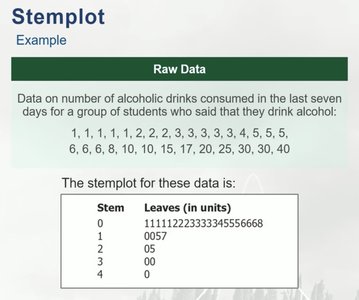
Stemplots (or stem-and-leaf plots) show all individual data values in a compact form. The last digit is the leaf, and all preceding digits make the stem. Useful for small data sets or when technology is not available.
Describing Numerical Distributions
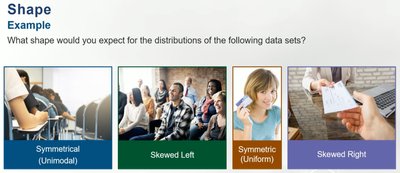
Shape
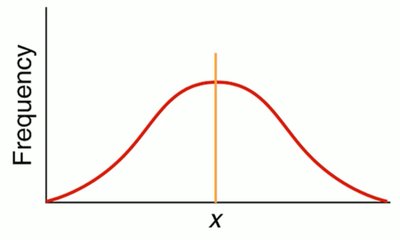
Symmetric: Left and right sides of the graph are roughly the same.
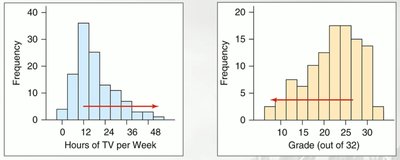
Skewed: Most data is on one side with a long tail on the other.
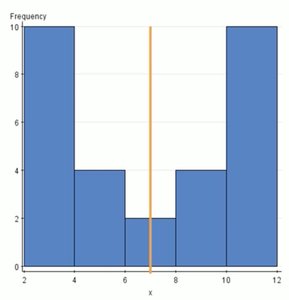
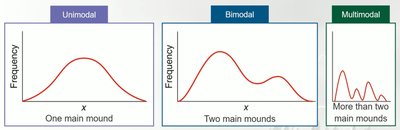
Mounds: The number of peaks or mounds in the distribution (unimodal, bimodal, multimodal).
Outliers: Extremely large or small values that do not fit the pattern of the rest of the data. Outliers should be reported and investigated further.
Center
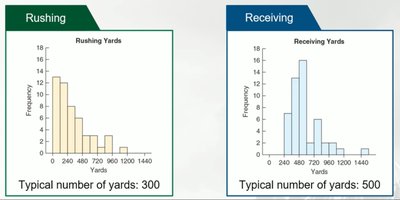
The center of a distribution is the typical data value. For example, histograms of total rushing and receiving yards for football players show different typical values.
Variability (Spread)
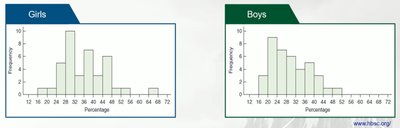
Variability refers to the horizontal spread of the data. Wide graphs indicate high variability; narrow graphs indicate low variability.
Describing Categorical Distributions
Bar Charts
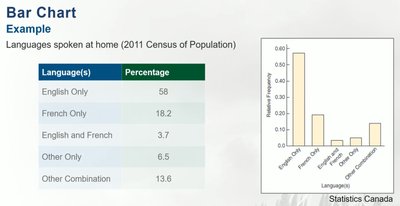
Bar charts display data categories on the horizontal axis, with bars representing the frequency or relative frequency of each category. Categories can be ordered in various ways.
Pie Charts
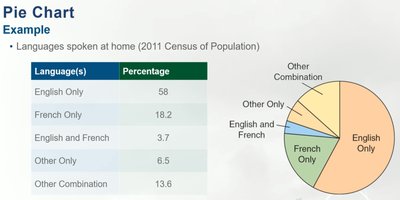
Pie charts show the proportion of observations in each category as wedges of a circle. Although common, pie charts are generally not recommended by statisticians due to difficulty in comparing areas accurately.
Bar Chart vs. Histogram
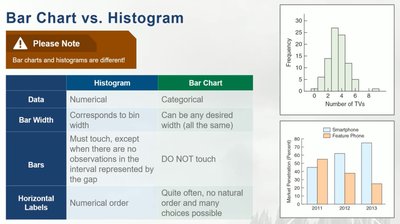
Histogram | Bar Chart | |
|---|---|---|
Data | Numerical | Categorical |
Bar Width | Corresponds to bin width | Any desired width (all the same) |
Bars | Must touch, except when there are no observations in the interval | Do NOT touch |
Horizontal Labels | Numerical order | No natural order; many choices possible |
Mode and Variability in Categorical Data
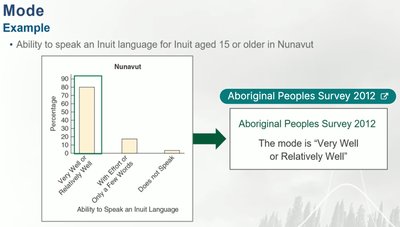
Mode: The category that occurs most often. For categorical data, modes must be roughly the same height.
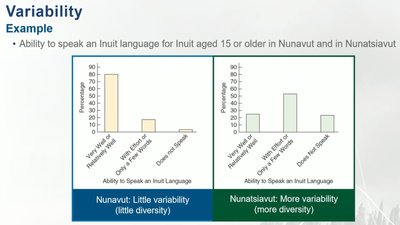
Variability: Diversity in the data values. High variability means many observations in many categories; low variability means many observations in only a few categories.
Misleading Graphs
Common Errors in Graphs
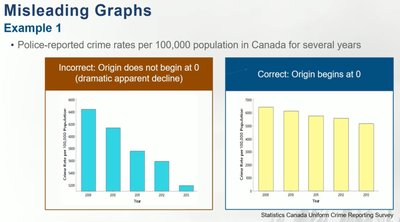
Frequency scale not beginning at zero, creating the illusion of greater differences
Shading or 3D effects that convey no information
Use of drawings instead of bars, which can hide or accentuate real differences
Axes with non-constant scale
Note: Raw data are ineffective for making comparisons; visual summaries are essential for clear communication.
