 Back
BackIntroduction to Probability: Key Concepts and Applications
Study Guide - Smart Notes
 Tailored notes based on your materials, expanded with key definitions, examples, and context.
Probability Fundamentals
Definitions and Key Concepts
Probability is the branch of mathematics that quantifies the likelihood of events occurring. It is foundational to statistics and is used to model uncertainty in real-world situations.
Probability: A measure of how likely an event is to occur, ranging from 0 (impossible) to 1 (certain).
Sample Space (S): The set of all possible outcomes of a random experiment.
Event: Any subset of the sample space.
Complementary Events: The event that an event A does not occur, denoted as Ac or A'.
Mutually Exclusive (Disjoint) Events: Events that cannot occur at the same time.
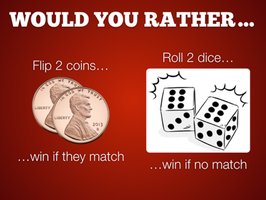
Example: Coins and Dice
Consider the following scenario: Would you rather flip 2 coins and win if they match, or roll 2 dice and win if they do not match? To answer, we must identify the sample space and calculate the relevant probabilities.
Sample Spaces in Common Experiments
Flipping 2 coins: Sample space = {HH, HT, TH, TT}
Rolling 2 dice: Sample space = 36 possible ordered pairs (1,1), (1,2), ..., (6,6)
Deck of Cards: 52 cards, 4 suits, 13 cards per suit, 3 face cards per suit
Types of Probability
Theoretical vs. Experimental Probability
There are two main approaches to probability:
Theoretical Probability: Based on the possible outcomes in the sample space, assuming all outcomes are equally likely.
Experimental Probability: Based on actual data from experiments or observations.
For example, the theoretical probability of flipping a coin and getting heads is 0.5, but in practice, the experimental probability may differ in a small number of trials.
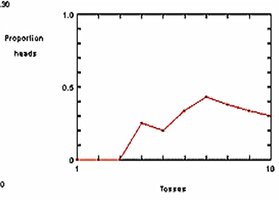
The Law of Large Numbers
The law of large numbers states that as the number of trials increases, the experimental probability of an event will approach its theoretical probability. This principle underlies much of statistical inference.
Calculating Probabilities
Probability of Sums with Two Dice
When rolling two dice, each sum from 2 to 12 has a different probability, depending on the number of combinations that yield that sum. For example, there is only one way to get a sum of 2 (1,1), but six ways to get a sum of 7.
Sum | Number of Ways |
|---|---|
2 | 1 |
3 | 2 |
4 | 3 |
5 | 4 |
6 | 5 |
7 | 6 |
8 | 5 |
9 | 4 |
10 | 3 |
11 | 2 |
12 | 1 |
Complementary Events
The probability that an event does not occur is equal to one minus the probability that it does occur:
Example: If the probability it will rain is 0.4, then the probability it will not rain is .
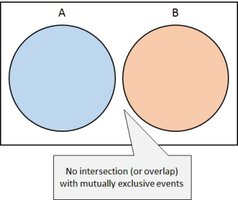
Mutually Exclusive (Disjoint) Events
Two events are mutually exclusive if they cannot both occur at the same time. For example, drawing a card that is both red and black is impossible.
Venn Diagrams and Probability Notation
Intersection and Union of Events
Intersection (AND): is the probability that both events A and B occur.
Union (OR): is the probability that at least one of the events A or B occurs.
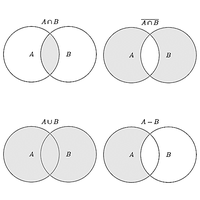
Examples with Venn Diagrams
Venn diagrams are useful for visualizing relationships between events, such as overlap (intersection), union, and complements.
Conditional Probability
Definition and Notation
Conditional probability is the probability of one event occurring given that another event has already occurred. The notation is , which reads as "the probability of A given B." The formula is:
(provided )
Example: What is the probability you take Spanish given that you take Chinese?
Tree Diagrams
Modeling Sequential Events
Tree diagrams are graphical representations that help model the probabilities of multiple events occurring in sequence. Each branch represents a possible outcome and its probability.
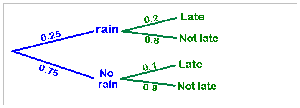
To find the probability of a sequence of events (e.g., it does not rain and you are not late), multiply the probabilities along the branches.
The sum of probabilities for all possible outcomes at each stage must equal 1.
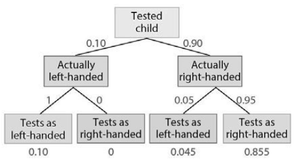
Example: Handedness Testing
Tree diagrams can also be used to model more complex scenarios, such as testing for left- or right-handedness in children, accounting for both actual and test outcomes.
Summary Table: Key Probability Terms
Term | Definition | Example |
|---|---|---|
Sample Space | Set of all possible outcomes | All 36 outcomes when rolling two dice |
Event | Subset of sample space | Getting a sum of 7 |
Complement | Event does not occur | Not getting heads in a coin toss |
Mutually Exclusive | Events cannot both occur | Card is red or black, not both |
Conditional Probability | Probability of A given B | Probability of rain given cloudy |
Additional info: Some context and examples were expanded for clarity and completeness, including the use of tree diagrams and Venn diagrams in probability calculations.
