 Back
BackIntroduction to Statistics: Concepts, Data, and Branches
Study Guide - Smart Notes
 Tailored notes based on your materials, expanded with key definitions, examples, and context.
Section 1.1: An Overview of Statistics
What is Data?
Data forms the foundation of statistics and consists of information gathered from observations, counts, measurements, or responses. It is used to draw conclusions or make decisions and can be either numerical (quantitative) or non-numerical (qualitative).
Observation: Recording information from experiments or surveys.
Numerical Data: Examples include height, weight, or test scores.
Non-numerical Data: Examples include colors, names, or categories.
Purpose: To inform decisions and support scientific inquiry.
What is Statistics?
Statistics is the science of collecting, organizing, analyzing, and interpreting data to make decisions. It involves designing studies, analyzing the resulting data, and learning from that data. The ultimate goal is to translate data into meaningful information and provide a measure of confidence in conclusions.
Key Steps:
Formulate a statistical question
Collect data
Organize and summarize data
Analyze data to draw conclusions
Interpret and report results with a measure of confidence
Confidence: Indicates how convinced we are that our conclusions are accurate and reliable.
Data Sets: Population vs. Sample
Understanding the distinction between a population and a sample is fundamental in statistics. A population includes all outcomes, responses, measurements, or counts of interest, while a sample is a subset of the population.
Population: The entire group being studied (e.g., all voters in an election).
Sample: A smaller group selected from the population (e.g., 3889 voters surveyed).
Individuals: The people or objects that are members of the population.
Example 1
Population: All 9.5 million people who voted in the 2010 California gubernatorial election.
Sample: The 3889 voters who were surveyed in the exit poll.
Example 2
Population: All employees in the United States.
Sample: The 834 employees surveyed.
Sample Data Set: Responses from the 834 employees, with 517 indicating their jobs were highly stressful.
The Process of Statistics
The statistical process involves several steps to ensure valid and reliable conclusions:
Identify the research objective: Clearly define the question and population to be studied.
Collect data: Gather information from a sample, as studying the entire population is often impractical.
Describe the data: Use methods to summarize and present data.
Perform inference: Draw conclusions about the population based on sample data.
Parameters vs. Statistics
A parameter is a numerical description of a population characteristic, while a statistic is a numerical description of a sample characteristic. These are often referred to as numerical summaries.
Parameter: Example: 48.2% of all students on campus own a car (population value).
Statistic: Example: 46% of 100 interviewed students own a car (sample value).
Example: Parameter or Statistic?
Parameter: Percentage of all Florida residents favoring handgun control.
Statistic: 54.0% of subjects interviewed at a Walmart in Florida favoring handgun control.
Branches of Statistics
Descriptive Statistics
Descriptive statistics involves organizing, summarizing, and displaying data. It describes data through numerical summaries, tables, and graphs, often based on samples.
Purpose: To summarize raw data and present it in a useful format (e.g., averages, charts, graphs).
Examples: Average amount of TV watched, graphs showing relationships between variables.
Example: Descriptive Statistics
A graph displaying how the number of hours of TV watched per day relates to the number of hours per week exercising.

Inferential Statistics
Inferential statistics uses sample data to draw conclusions about a population. It involves making decisions or predictions and measuring the reliability of results. Since samples are incomplete representations of populations, inferential statistics contains uncertainty.
Purpose: To extend results from a sample to the population and assess reliability.
Examples: Determining if global warming has occurred, assessing the impact of the death penalty on crime rates, evaluating factors affecting student performance.
Descriptive vs. Inferential Statistics: Examples
Example 1
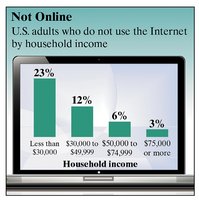
Population: All U.S. adults not using the Internet.
Sample: 2560 U.S. adults surveyed.
Descriptive Statistics: 23% of adults not using the Internet are from households earning less than $30,000 annually.
Inferential Statistics: A possible inference is that lower household income is associated with a higher likelihood of not using the Internet among U.S. adults.
Example 2
Population: All Wall Street analysts.
Sample: 300 Wall Street analysts surveyed.
Descriptive Statistics: 44% incorrectly forecasted high-tech earnings.
Inferential Statistics: A possible inference is that a significant proportion of Wall Street analysts may have difficulty accurately forecasting high-tech earnings.
Summary Table: Population vs. Sample, Parameter vs. Statistic
Concept | Definition | Example |
|---|---|---|
Population | Entire group of interest | All voters in an election |
Sample | Subset of the population | 3889 voters surveyed |
Parameter | Numerical summary of a population | 48.2% of all students own a car |
Statistic | Numerical summary of a sample | 46% of 100 students own a car |
Key Formulas
Sample Proportion: where is the number of individuals with the characteristic, and is the sample size.
Population Proportion: where is the number of individuals with the characteristic in the population, and is the population size.
