Back
BackIntroduction to Statistics: Concepts, Definitions, and the Statistical Study Process
Study Guide - Smart Notes
 Tailored notes based on your materials, expanded with key definitions, examples, and context.
Introduction to Statistics
What Is/Are Statistics?
Statistics is a foundational discipline that informs decision-making in nearly every field, from medicine and business to sports and public policy. It provides the tools to collect, organize, analyze, and interpret data, enabling us to draw meaningful conclusions about the world around us.
Statistics (singular): The science of collecting, organizing, and interpreting data.
Statistics (plural): The actual data (numbers or information) that describe or summarize something.
Data: Pieces of information collected about a subject. Grammatically, 'data' is plural (singular: datum).
Example: In a class of 30 students aged 17 to 64, the numbers "30 students," "17 years," and "64 years" are statistics describing the class.
How Statistics Works
Statistical studies allow us to make inferences about large populations based on data collected from smaller samples. For example, television ratings are estimated from a sample of households, not every viewer.
Population: The complete set of people or things being studied.
Population Parameter: A specific number describing a characteristic of the population.
Example: To determine the average insurance payout for accidents in cars without side-impact airbags, the population is all such accident victims, and the parameter is the average payout.
Populations, Samples, and Data
Samples and Sample Statistics
Because it is often impractical to study an entire population, researchers collect data from a sample, a subset of the population. The measurements collected are called raw data, and summary numbers calculated from the sample are called sample statistics.
Sample: A subset of the population from which data are actually obtained.
Raw Data: The actual measurements or observations collected from the sample.
Sample Statistic: A number describing a characteristic of the sample, found by summarizing the raw data.
Example: The U.S. Labor Department surveys 60,000 households to estimate the unemployment rate. The population is the entire civilian labor force, the sample is the surveyed households, and the sample statistic is the percentage of surveyed people seeking employment.

Relationship Between Sample Statistics and Population Parameters
Sample statistics are used to estimate population parameters. Because only a sample is studied, there is always some uncertainty in the estimate. This uncertainty is quantified using the margin of error and confidence intervals.
Margin of Error: Describes the range of values likely to contain the population parameter. For a 95% confidence interval, we expect that 95% of such intervals from repeated samples would contain the true parameter.
Formula:
Example: If 74% of a sample of 9,680 Americans believe media criticism of politicians is worthwhile, with a margin of error of 1.3%, the 95% confidence interval is 72.7% to 75.3%.
The Process of a Statistical Study
Basic Steps in a Statistical Study
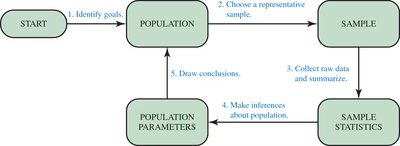
Statistical studies follow a systematic process to ensure valid and reliable results. The process can be summarized in five key steps:
State the goals of your study precisely. Define the population and what you want to learn.
Choose a representative sample from the population.
Collect raw data from the sample and summarize these data by finding sample statistics of interest.
Use the sample statistics to make inferences about the population.
Draw conclusions: Determine what you learned and whether you achieved your goal.
Descriptive vs. Inferential Statistics
Statistics is divided into two main branches:
Descriptive Statistics: Describes raw data using graphics and sample statistics.
Inferential Statistics: Makes inferences or estimates about population parameters based on sample data.
Additional info: Descriptive statistics are covered in early chapters, while inferential statistics are addressed in later chapters.
Statistics in Decision-Making
The Purpose of Statistics
The primary purpose of statistics is to help us make informed decisions in situations involving uncertainty. This is achieved by applying statistical methods to real-world problems, such as evaluating new medical treatments or analyzing public opinion.
Example: In 1954, a large experiment tested the effectiveness of the Salk polio vaccine. Out of 400,000 children, half received the vaccine and half received a placebo. Only 33 vaccinated children contracted polio, compared to 115 in the placebo group. Statistical analysis confirmed the vaccine's effectiveness, leading to widespread immunization efforts.

Key Terms and Definitions
Term | Definition |
|---|---|
Population | The complete set of people or things being studied. |
Sample | A subset of the population from which data are collected. |
Population Parameter | A specific number describing a characteristic of the population. |
Sample Statistic | A number describing a characteristic of the sample. |
Raw Data | The actual measurements or observations collected from the sample. |
Margin of Error | The range within which the true population parameter is expected to lie, with a certain level of confidence. |
Confidence Interval | The interval calculated from the sample statistic plus or minus the margin of error, likely to contain the population parameter. |
Case Study: The Salk Polio Vaccine
Case studies are used throughout statistics to illustrate the application of statistical methods to real-world problems. The Salk polio vaccine trial is a classic example of how statistical science can inform public health decisions.