 Back
BackIntroduction to Statistics: Data Classification and Levels of Measurement
Study Guide - Smart Notes
 Tailored notes based on your materials, expanded with key definitions, examples, and context.
Chapter 1: Introduction to Statistics
Section 1.2: Data Classification
This section introduces the foundational concepts of data classification in statistics, focusing on the types of data, their levels of measurement, and the context required to interpret data meaningfully.
The Six “W’s” of Data Context
Who: The individuals or units being studied (not limited to people; can include objects, animals, measurements, etc.).
What: The variable being measured or observed.
When: The time period during which the data was collected.
Where: The location or setting of the data collection.
Why: The purpose or motivation behind the data collection or experiment.
How: The method or process used to collect the data.
Example: In a survey of 1,174 U.S. adults conducted March 3–4, 2025, about cost of living trends, the 'who' is U.S. adults, the 'what' is opinions on cost of living, 'when' is March 3–4, 2025, 'where' is the USA, 'why' is to measure public concern, and 'how' is a random representative sample.
Populations and Samples
Population: The entire group of individuals or items of interest.
Sample: A subset of the population, selected for analysis.
Example: All U.S. adults (population); 1,174 surveyed adults (sample).
Types of Data
Qualitative (Categorical) Data: Non-numerical attributes or labels (e.g., eye color, place of birth, major).
Quantitative (Numerical) Data: Numerical measurements or counts with units (e.g., age in years, weight in grams, temperature in °F or °C).
Example Classification:
Age – Quantitative
Gender – Qualitative
Mileage of a car – Quantitative
Color of a car – Qualitative
Identifier Variables
Identifier Variable: A variable used to uniquely identify an individual, not to describe them (e.g., Student ID, Social Security Number, Transaction Number).
Levels of Measurement
Levels of measurement describe how data values are categorized and what mathematical operations are meaningful. There are four levels:
Nominal Level: Qualitative data only; categorized by names, labels, or qualities; no mathematical computations possible.
Ordinal Level: Qualitative or quantitative; data can be ordered or ranked, but differences between entries are not meaningful.
Interval Level: Quantitative; data can be ordered, differences are meaningful, but zero is not a true zero (does not imply 'none').
Ratio Level: Quantitative; similar to interval, but zero is an inherent zero (implies 'none'); ratios are meaningful.
Examples of Levels of Measurement
Nominal: State of residence, gender (no natural order).
Ordinal: Letter grade (A, B, C, D, F), size of a soft drink (small, medium, large) (natural order, but differences not meaningful).
Interval: Temperature in °C or °F (differences are meaningful, but zero does not mean 'no temperature').
Ratio: Cost of a textbook, weight, age (zero means none, ratios are meaningful; e.g., $60 is twice $30).
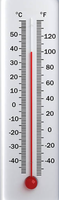
Image explanation: The thermometer illustrates interval data, where temperature differences are meaningful, but zero does not represent an absence of temperature.

Image explanation: The dollar bill represents ratio data, where zero dollars means no money, and ratios (e.g., $2 is twice $1) are meaningful.
Summary Table: Four Levels of Measurement
Level | Type of Data | Order Meaningful? | Differences Meaningful? | True Zero? | Example |
|---|---|---|---|---|---|
Nominal | Qualitative | No | No | No | Gender, State |
Ordinal | Qualitative/Quantitative | Yes | No | No | Letter Grade, Drink Size |
Interval | Quantitative | Yes | Yes | No | Temperature (°C/°F) |
Ratio | Quantitative | Yes | Yes | Yes | Cost, Weight, Age |
Key Formulas and Notation
Ratio Calculation Example:
\frac{\text{Cost of Book 1}}{\text{Cost of Book 2}} = \frac{60}{30} = 2 \$
Additional info: Understanding the level of measurement is crucial for selecting appropriate statistical methods and interpreting results accurately.
