 Back
BackIntroduction to Statistics: Data Collection and Types of Variables
Study Guide - Smart Notes
 Tailored notes based on your materials, expanded with key definitions, examples, and context.
Introduction to Statistics
Objectives of Statistical Study
This section introduces the foundational concepts and objectives in statistics, focusing on understanding data, variables, and the process of statistical analysis. The main goals are to define statistics, explain the statistical process, and distinguish between different types of variables and measurements.
Defining Statistics and Statistical Thinking
What is Statistics?
Statistics is the science of collecting, organizing, analyzing, and interpreting data to make decisions or answer questions. Statistical thinking involves understanding the process of data collection and analysis, and recognizing the variability and uncertainty inherent in data.
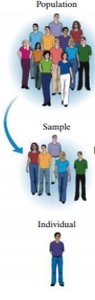
Population: The entire group to be studied.
Individual: A single member of the population.
Sample: A subset of the population selected for study.
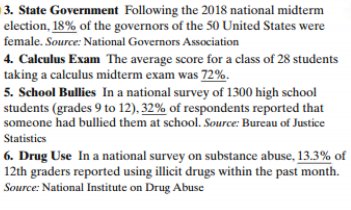
Parameters and Statistics
A parameter is a numerical summary of a population, while a statistic is a numerical summary of a sample. Data collected from a sample are used to estimate parameters of the population.
Example: If the average score of all students in a school is known, it is a parameter. If the average score is calculated from a sample of students, it is a statistic.
The Process of Statistics
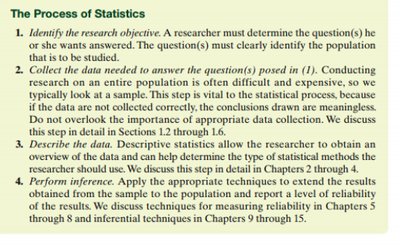
Four-Step Statistical Process
The process of statistics involves a systematic approach to answering research questions using data. The four main steps are:
Identify the research objective: Clearly state the question and identify the population of interest.
Collect the data: Gather data relevant to the research objective, often using a sample due to practical constraints.
Describe the data: Use descriptive statistics to summarize and organize the data.
Perform inference: Apply inferential statistics to draw conclusions about the population based on the sample data, including measuring the reliability of the results.
Types of Variables
Qualitative vs. Quantitative Variables
Variables are characteristics or properties that can take on different values among individuals in a population. They are classified as follows:
Qualitative (Categorical) Variables: Allow for classification based on attributes or characteristics (e.g., gender, eye color).
Quantitative Variables: Provide numerical measures and can be further classified as discrete or continuous.
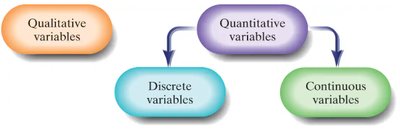
Discrete vs. Continuous Variables
Discrete Variable: A quantitative variable with a finite or countable number of possible values (e.g., number of siblings, number of cars).
Continuous Variable: A quantitative variable with an infinite number of possible values within a range (e.g., height, distance, volume).
Examples:
Number of heads in five coin flips: Discrete
Distance a car can travel on a full tank: Continuous
Distinguishing Variables and Data
Individuals, Variables, and Data
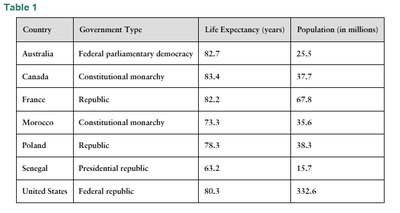
In a statistical study, individuals are the entities being studied, variables are the characteristics measured, and data are the observed values for these variables.
Example Table: The following table presents selected countries and information about their government type, life expectancy, and population size.
Country | Government Type | Life Expectancy (years) | Population (in millions) |
|---|---|---|---|
Australia | Federal parliamentary democracy | 82.7 | 25.5 |
Canada | Constitutional monarchy | 83.4 | 37.7 |
France | Republic | 82.2 | 67.8 |
Morocco | Constitutional monarchy | 73.3 | 35.6 |
Poland | Republic | 78.3 | 38.3 |
Senegal | Presidential republic | 63.2 | 15.7 |
United States | Federal republic | 80.3 | 332.6 |
Levels of Measurement
Four Levels of Measurement
Variables can be measured at different levels, which determine the types of statistical analyses that are appropriate:
Nominal: Values name, label, or categorize without a meaningful order (e.g., gender, eye color).
Ordinal: Values can be ranked or ordered, but differences between values are not meaningful (e.g., letter grades, movie ratings).
Interval: Ordered values with meaningful differences, but zero does not indicate absence of quantity (e.g., temperature in Celsius).
Ratio: Ordered values with meaningful differences and ratios; zero indicates absence of quantity (e.g., height, weight, age).
Key Questions for Determining Level of Measurement:
Does the variable simply categorize? (Nominal)
Does it categorize and allow ranking? (Ordinal)
Do differences have meaning, but zero does not mean absence? (Interval)
Do ratios have meaning and is there a true zero? (Ratio)
Summary Table: Types and Levels of Variables
Type | Subtypes | Examples | Level of Measurement |
|---|---|---|---|
Qualitative | — | Gender, Eye Color, Nation of Origin | Nominal, Ordinal |
Quantitative | Discrete | Number of Siblings, Goals Scored | Ratio |
Quantitative | Continuous | Height, Volume, Distance | Interval, Ratio |
Additional info: This guide covers the foundational concepts from Chapter 1: Data Collection, including definitions, types of variables, and the process of statistics. These concepts are essential for understanding later topics such as data summarization, probability, and inferential methods.
