 Back
BackIntroduction to Statistics: Data, Sampling, and Experimental Design
Study Guide - Smart Notes
 Tailored notes based on your materials, expanded with key definitions, examples, and context.
Introduction to Statistics
Statistics is the science of collecting, analyzing, interpreting, and presenting data. It is essential for making informed decisions in various fields such as business, health, education, and social sciences. Understanding statistics enables individuals to critically evaluate information and make data-driven decisions.
Definitions of Statistics, Probability, and Key Terms
Statistics and Probability
Statistics involves methods for collecting, organizing, summarizing, and interpreting data.
Probability is the mathematical study of randomness and uncertainty, used to predict the likelihood of events.
Statistics is divided into two main branches:
Descriptive statistics: Methods for summarizing data using graphs and numerical measures (e.g., mean, median).
Inferential statistics: Methods for making predictions or inferences about a population based on sample data, often using probability theory.
Key Terms
Population: The entire group of individuals or items under study.
Sample: A subset of the population selected for analysis.
Parameter: A numerical characteristic of a population (e.g., population mean μ).
Statistic: A numerical characteristic calculated from a sample (e.g., sample mean \( \bar{x} \)).
Variable: A characteristic or measurement that can vary among individuals in a population (e.g., height, income).
Data: The observed values of a variable.
Types of Data
Qualitative (Categorical) Data
Qualitative data describe attributes or categories. Examples include eye color, type of car, or student classification.
Cannot be meaningfully averaged or ordered (unless ordinal).
Quantitative Data
Quantitative data are numerical and can be measured or counted.
Discrete data: Countable values (e.g., number of books, number of students).
Continuous data: Measurable values that can take any value within a range (e.g., weight, height, time).
Examples of Data Types
Number of books: Quantitative discrete
Weight of a backpack: Quantitative continuous
Color of a backpack: Qualitative
Describing Data with Tables and Graphs
Frequency Tables
Frequency tables organize data values and their counts. They can also include relative frequency (proportion of total) and cumulative relative frequency (running total of proportions).
Graphs for Qualitative Data
Pie charts: Show proportions of categories as slices of a circle.
Bar graphs: Use bars to represent the frequency or proportion of categories.
Pareto charts: Bar graphs with categories ordered from largest to smallest.
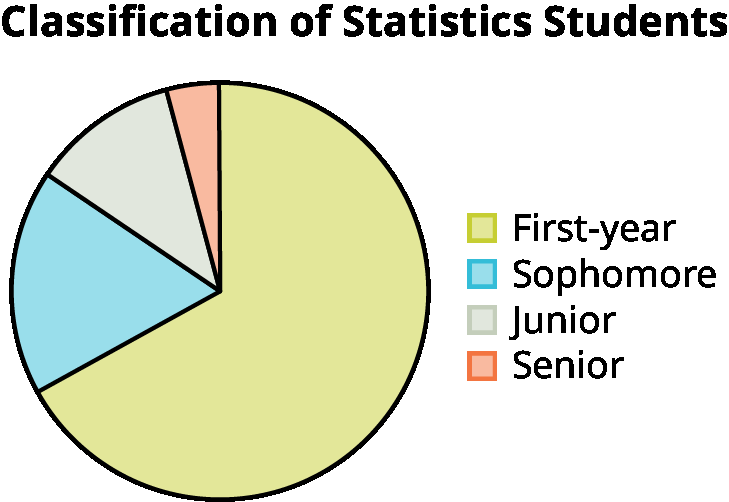
Example: The pie chart above displays the classification of statistics students (first-year, sophomore, junior, senior), which is qualitative (categorical) data.
Graphs for Quantitative Data
Histograms: Show the distribution of quantitative data by grouping values into intervals (bins).
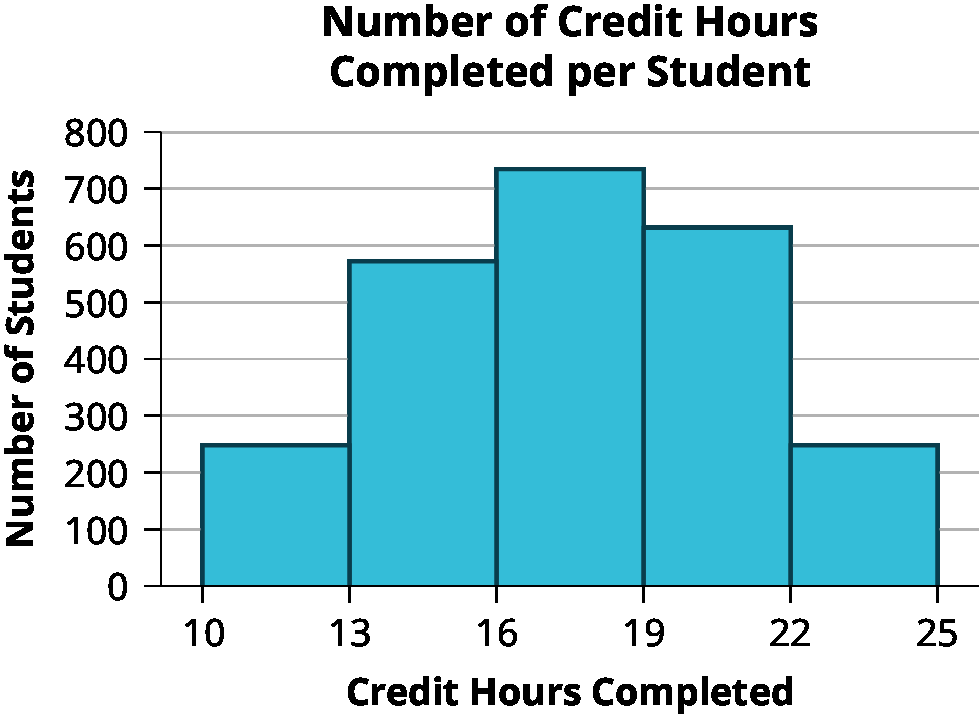
Example: The histogram above shows the number of credit hours completed per student, which is quantitative discrete data.
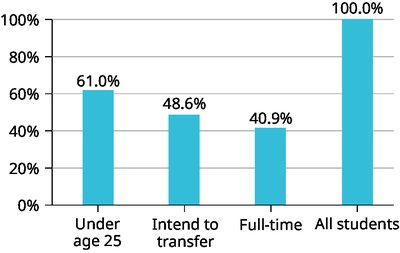
Comparing Groups with Graphs
Pie charts and bar graphs can be used to compare proportions between groups or institutions.
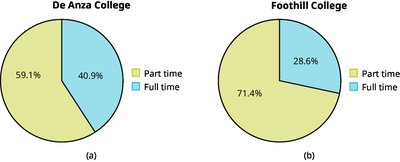
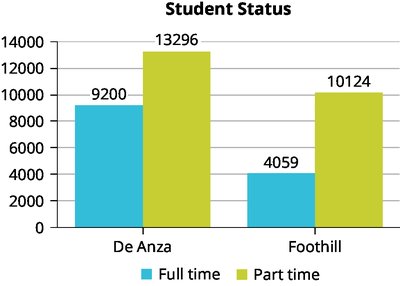
Example: The pie charts and bar graph above compare the proportions and counts of part-time and full-time students at De Anza College and Foothill College.
Special Cases in Graphs
Percentages may add to more than 100% if individuals can belong to multiple categories.
Missing categories (e.g., "Other/Unknown") should be included for accurate representation.
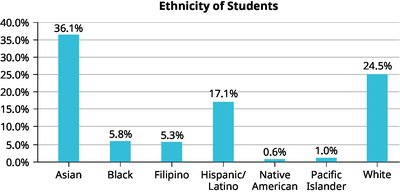
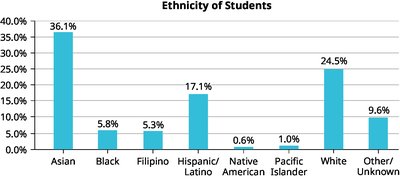
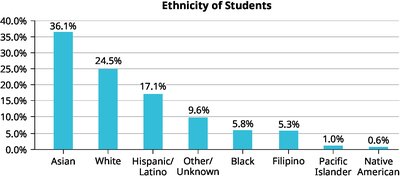
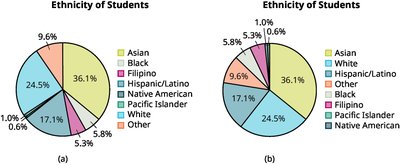
Example: The bar graphs and pie charts above illustrate the importance of including all categories and sorting for clarity when displaying categorical data.
Sampling Methods
Random Sampling Techniques
Simple random sampling: Every member of the population has an equal chance of being selected.
Stratified sampling: Population is divided into strata (groups), and a random sample is taken from each stratum.
Cluster sampling: Population is divided into clusters, some clusters are randomly selected, and all members of selected clusters are included.
Systematic sampling: Every nth member is selected from a list after a random starting point.
Convenience sampling: Sample is taken from individuals who are easiest to reach (often biased).
Sampling Errors and Bias
Sampling error: Natural variation due to using a sample instead of the whole population.
Sampling bias: Systematic error due to non-random sampling or underrepresentation of certain groups.
Nonsampling error: Errors not related to the act of sampling, such as data entry mistakes or faulty measurement tools.
Levels of Measurement
Data can be classified into four levels of measurement, which determine the types of statistical analyses that are appropriate:
Nominal: Categories with no inherent order (e.g., colors, brands).
Ordinal: Categories with a meaningful order but no measurable difference between values (e.g., rankings).
Interval: Ordered values with measurable differences, but no true zero (e.g., temperature in Celsius).
Ratio: Ordered values with measurable differences and a true zero (e.g., height, weight, age).
Experimental Design and Ethics
Components of Experimental Design
Explanatory variable: The variable manipulated by the researcher (independent variable).
Response variable: The outcome measured (dependent variable).
Treatments: Different conditions applied to experimental units.
Control group: Receives a placebo or standard treatment for comparison.
Random assignment: Assigning subjects to treatments by chance to reduce bias.
Blinding: Keeping subjects and/or researchers unaware of treatment assignments to prevent bias (single-blind or double-blind).
Lurking variables: Uncontrolled variables that may affect the response variable.
Ethical Considerations
Studies must be designed to avoid harm, ensure informed consent, and report results honestly.
Professional guidelines and federal regulations provide standards for ethical research.
Summary Table: Types of Sampling Methods
Sampling Method | Description | Example |
|---|---|---|
Simple Random | Every member has equal chance of selection | Randomly select 100 students from a list |
Stratified | Divide population into groups, sample from each | Sample 25 students from each grade level |
Cluster | Divide into clusters, randomly select clusters, include all in selected clusters | Randomly select 3 classes, survey all students in those classes |
Systematic | Select every nth member after a random start | Survey every 10th person on a list |
Convenience | Sample those easiest to reach | Survey students in the library |
Summary Table: Levels of Measurement
Level | Order? | Equal Intervals? | True Zero? | Example |
|---|---|---|---|---|
Nominal | No | No | No | Eye color |
Ordinal | Yes | No | No | Class rank |
Interval | Yes | Yes | No | Temperature (°C) |
Ratio | Yes | Yes | Yes | Height |
Summary Table: Frequency Table Example
Data Value | Frequency | Relative Frequency | Cumulative Relative Frequency |
|---|---|---|---|
2 | 3 | 0.15 | 0.15 |
3 | 5 | 0.25 | 0.40 |
4 | 3 | 0.15 | 0.55 |
5 | 6 | 0.30 | 0.85 |
6 | 2 | 0.10 | 0.95 |
7 | 1 | 0.05 | 1.00 |
Key Formulas
Mean (Arithmetic Average):
Relative Frequency:
Cumulative Relative Frequency:
Conclusion
Understanding the foundational concepts of statistics—including types of data, sampling methods, levels of measurement, and experimental design—is essential for analyzing and interpreting data accurately. Proper use of tables, graphs, and statistical terminology ensures clear communication and valid conclusions in research and everyday decision-making.
