 Back
BackIntroduction to Statistics: Data, Sampling, and Statistical Thinking
Study Guide - Smart Notes
 Tailored notes based on your materials, expanded with key definitions, examples, and context.
Statistics, Data, and Statistical Thinking
The Science of Statistics
Statistics is the science of data, encompassing the processes of collecting, classifying, summarizing, organizing, analyzing, presenting, and interpreting both numerical and categorical information. It provides a systematic approach to understanding and making decisions based on data.
Collecting Data: Gathering information from various sources.
Classifying Data: Organizing data into categories or groups.
Summarizing Data: Using numerical and graphical methods to describe data.
Analyzing Data: Applying statistical techniques to extract insights.
Presenting Data: Displaying data in tables, charts, or graphs.
Interpreting Data: Drawing conclusions and making decisions based on analysis.
Importance of Statistics
Statistics is fundamental in numerous fields and everyday life. It enables critical analysis of information, supports decision-making, and helps avoid misinformation.
Business & Economics: Finance, marketing, operations.
Social Sciences: Psychology, sociology, political science.
Health & Medicine: Clinical trials, epidemiology, public health.
Engineering & Technology: Quality control, reliability.
Natural Sciences: Biology, environmental studies, physics.
Computer Science: Machine learning.
Daily Life: Critical analysis of news, sports statistics, avoiding manipulation.
Methods for Describing Sets of Data
Types of Data
Data can be classified into two main types: numerical (quantitative) and categorical (qualitative).
Numerical (Quantitative) Data: Values representing counts or measurements.
Discrete Data: Countable values (e.g., shoe size, family size).
Continuous Data: Measurable values (e.g., temperature, age, height).
Categorical (Qualitative) Data: Values describing qualities or attributes (e.g., hair color, employment status).
Types of Statistical Applications
Statistics is divided into two main branches: descriptive and inferential statistics.
Descriptive Statistics: Methods for summarizing and describing a data set you already have.
Typical outputs: mean, median, mode, min/max, range, variance, standard deviation, percentiles.
Graphical methods: histograms, bar charts, boxplots, scatterplots.
Example: In a class, the average exam score is 62, the median is 65, and scores range from 30 to 98.
Inferential Statistics: Methods for using a sample to draw conclusions about a larger population, with uncertainty explicitly accounted for.
Typical tools: estimation (confidence intervals), hypothesis testing (p-values, significance tests).
Example: From a random sample of 50 voters, estimate candidate’s support as 52% ± 6%.
Sampling and Data Collection
Key Concepts in Sampling
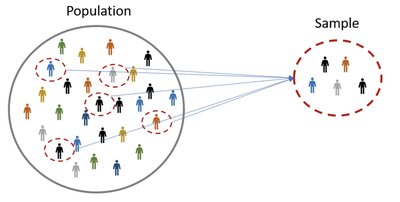
Sampling is the process of selecting a subset of units from a population to make inferences about the whole.
Experimental (or Observational) Unit: The object about which data is collected (e.g., one student).
Variable: A characteristic or property of an individual unit (e.g., exam score).
Population: The set of all units of interest (e.g., all students).
Sample: A subset of the population (e.g., 50 students).
Statistic: Numerical summary calculated from a sample (e.g., sample average).
Parameter: Numerical summary describing a population (e.g., population average).
Random Sampling
Random sampling is essential for obtaining representative samples from a population. It ensures that every possible sample of a given size has an equal chance of being selected.
Simple Random Sample: Every sample of size n has an equal chance of selection.
Other Sampling Methods: Stratified, cluster, systematic, randomized response sampling.
Methods of Data Collection
Data can be collected from various sources and methods:
Published Source: Books, journals, newspapers, web.
Designed Experiment: Researcher controls units, often with treatment and control groups (e.g., drug studies).
Observational Study: Researcher observes units in their natural setting (e.g., surveys, studies about smoking).
Example: Starbucks Price Perception Study
This example illustrates the application of sampling and statistical thinking in a real-world context.
Experimental Unit: Individual customer in the survey.
Variable of Interest: Response to "Do you think Starbucks is reasonably priced?" (Yes/No).
Population: All Starbucks customers in Türkiye.
Sample: 300 customers surveyed in 20 randomly selected stores.
Parameter: True proportion of all Starbucks Türkiye customers who think Starbucks is reasonably priced.
Statistic: Proportion of the 300 surveyed customers who answered "Yes" (e.g., 62%).
Purpose: Estimate customer perceptions, provide insights beyond sales data, inform management decisions on pricing strategy.
Statistics and Computation
Role of Computation in Statistics
Modern statistics relies heavily on computational tools for analysis. Common software includes R, Python, SPSS, and Excel. In introductory courses, Excel is often used for its accessibility and basic statistical functions.
Descriptive Analysis: Calculating means, medians, standard deviations.
Basic Inference: Confidence intervals, hypothesis tests.
Overview of Course Structure
Topics Covered in MATH 201
The course is structured into three main parts:
Part 1 - Descriptive Statistics: Numerical measures (mean, median, standard deviation), graphical methods (histograms, box plots).
Part 2 - Probability: Random variables, normal distribution, central limit theorem.
Part 3 - Inferential Statistics: Confidence intervals, hypothesis tests.
Key Terms and Formulas
Definitions
Mean: The average value of a data set.
Median: The middle value when data is ordered.
Mode: The most frequently occurring value.
Variance: Measure of data spread.
Standard Deviation: Square root of variance.
Confidence Interval: Range likely to contain the population parameter.
Additional info: Expanded explanations and formulas were added for completeness and academic context.
