 Back
Introduction to Statistics: Data, Variables, and Data Organization
Study Guide - Smart Notes
 Tailored notes based on your materials, expanded with key definitions, examples, and context.
Section 1.1: What Are Data and Statistics?
Definition and Purpose of Statistics
Statistics is the science of collecting, organizing, summarizing, and analyzing data to answer questions and draw conclusions. It is a foundational discipline for understanding the world through evidence and patterns.
Exploration: Statistics helps us explore and understand the world around us.
Evidence-Based Reasoning: It allows us to use data to test beliefs and hypotheses.
Discovery: Patterns found in data can lead to new discoveries.
Communication: Sharing findings with others is a key part of the statistical process.
Important Considerations:
Statistics must be used carefully to avoid inaccurate conclusions.
Results are always subject to uncertainty due to variability in data.
Major Concepts in Statistics
Data Collection: Gathering information from observations, surveys, or experiments.
Data Analysis: Examining and interpreting data to extract meaningful information.
Data analysis involves understanding different types of data, how data is stored, and how it is summarized to make sense of real-world phenomena.
Section 1.2: Classifying and Storing Data
Data Sources: Population and Sample
Data can be collected from two main sources:
Population: The entire collection of all data values for a group of interest. It is often impractical to collect data from the whole population.
Sample: A subset of the population, selected to represent the population. Sampling is more practical and cost-effective.
Example: To determine the predominant hair color in a country, a random sample of 2,500 people is surveyed. The population is all people in the country; the sample is the 2,500 surveyed individuals; the data collected is their reported hair color.
Classifying Data: Types of Variables
Variables are characteristics of people or things that can take on different values. There are two main types:
Categorical (Qualitative) Variables: Describe qualities or categories (e.g., type of pet, letter grade).
Numerical (Quantitative) Variables: Represent measurable quantities (e.g., height, GPA, hours worked).
Example: Classifying Variables
Variable | Numerical | Categorical |
|---|---|---|
Height of a bridge | X | |
GPA | X | |
Letter grade in class | X | |
Hours worked each week | X | |
Type of pets owned (cat, dog, etc.) | X | |
Flower varieties planted in a garden | X |
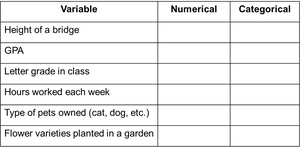
Additional info: Numerical variables can be further classified as discrete (countable) or continuous (measurable on a scale).
Example: Identifying Variable Types in a Data Table
The following table presents data from crash-test dummy studies. Each row represents a car and its observed characteristics.
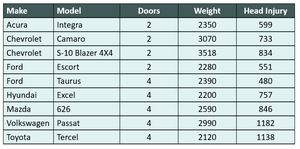
Categorical Variables: Make, Model, Doors (if treated as a category)
Numerical Variables: Weight, Head Injury, Doors (if treated as a number)
Additional info: The distinction between categorical and numerical variables is important for choosing appropriate statistical methods.
Storing Data: Coding, Stacked, and Unstacked Formats
Coded Data: Categorical data can be represented with numbers for easier analysis (e.g., Gender: 0 = No, 1 = Yes).
Stacked Data: Data is stored in a spreadsheet format where each row is an individual and each column is a variable. This format allows for multiple variables and observations.
Unstacked Data: Data for different groups are stored in separate columns. Each column represents a variable for a specific group, and rows do not correspond to the same individual.
Example: Movie Data Table
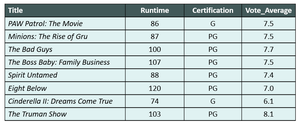
This table is an example of stacked data: each row is a movie (an observation), and columns are variables (Title, Runtime, Certification, Vote_Average). There are four variables and eight observations.
Additional info: Stacked data is the standard format for most statistical software and analyses.
