 Back
Introduction to Statistics: Data, Variables, and Displaying Categorical Data
Study Guide - Smart Notes
 Tailored notes based on your materials, expanded with key definitions, examples, and context.
Introduction to Statistics
What is Statistics?
Statistics is both a discipline and a set of tools for understanding the world through data. It involves reasoning, methods, and calculations that help us interpret information and make informed decisions.
Statistics (discipline): A way of reasoning and a collection of tools for understanding data.
Statistics (plural): Calculations made from data, such as averages or percentages.
Data: Values with a context, describing characteristics of objects or individuals.
The W's of Data Context
To fully understand any dataset, consider the following:
Who: The objects or individuals described (e.g., students, cars).
What: The variable(s) being recorded (e.g., age, grade).
When: The time period of data collection.
Where: The location of data collection.
Why: The purpose of collecting the data.
How: The method of data collection.
Example: Age of students taking Math 2208 in September 2026 at MSVU.
Who: Students in Math 2208
What: Age
When: September 2026
Where: MSVU
Types of Variables
Classification of Variables
Variables are characteristics recorded about each object or individual. They are classified as follows:
Quantitative Variable: Measured with units; numbers have meaning (e.g., price of gas, final grade).
Categorical (Qualitative) Variable: Identifies group or category; not measured on a numerical scale (e.g., car model, hair color).
Identifier: Unique value for each object (e.g., student ID); not used in analysis.
Ordinal Variable: Reports order without natural units; often considered categorical (e.g., ratings from 1 to 5).
Distribution: The values taken on by a variable and the pattern of those values.
Displaying and Describing Categorical Data
Organizing Categorical Data
Categorical data is best organized and displayed using tables and charts. The process begins with creating frequency tables:
Frequency Table: Shows counts for each category.
Relative Frequency Table: Shows proportions or percentages for each category.
When constructing plots, always label axes or pie slices, add a title, and avoid unnecessary colors.
Graphical Displays: Bar Charts and Pie Charts
Bar charts and pie charts are common methods for displaying categorical data. Bar charts show counts or percentages for each category, while pie charts show proportions as slices of a circle.
Bar Chart: Useful for comparing counts or percentages across categories.
Pie Chart: Useful for showing the proportion of each category within the whole.
Example: Distribution of High School Location
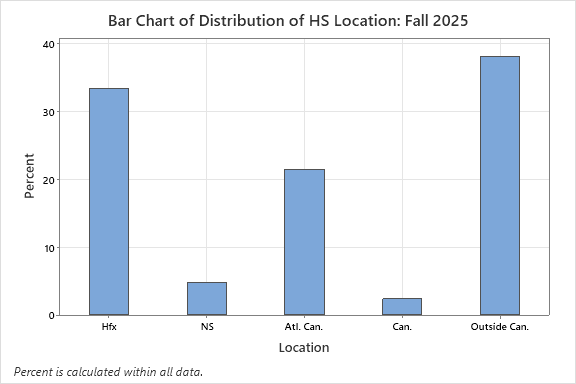
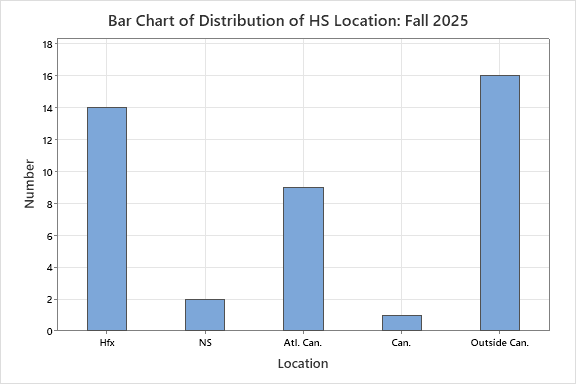
Consider a data collection study on where students graduated from high school. The categories might include Halifax area, Nova Scotia (outside HRM), Atlantic Canada, elsewhere in Canada, and outside Canada. The results can be displayed in frequency and relative frequency tables, as well as bar charts.
Location | Frequency | Relative Frequency (%) |
|---|---|---|
Halifax area (Hfx) | 14 | 33 |
Nova Scotia (NS) | 2 | 5 |
Atlantic Canada (Atl. Can.) | 9 | 21 |
Elsewhere in Canada (Can.) | 1 | 3 |
Outside Canada | 16 | 38 |
Bar Chart Example: The following bar charts display the distribution of high school location by frequency and by percent.
Key Points for Displaying Categorical Data
Always organize data into tables before creating charts.
Label all axes and provide clear titles for charts.
Use bar charts for comparing categories; use pie charts for showing proportions.
Relative frequency tables are useful for comparing groups of different sizes.
Formulas
Relative Frequency:
Additional info: The notes provide foundational concepts for Ch. 1 (Stats Starts Here) and Ch. 2 (Displaying and Describing Categorical Data), including definitions, types of variables, and graphical displays. The bar charts included are directly relevant to the explanation of categorical data display.
