 Back
Introduction to Statistics: Exploring and Understanding Data
Study Guide - Smart Notes
 Tailored notes based on your materials, expanded with key definitions, examples, and context.
Statistics Starts Here
Populations and Samples
Statistics begins with the study of populations and samples. Understanding these concepts is fundamental to collecting and analyzing data.
Population: The entire collection of individuals or objects of interest in a study.
Sample: A subset of the population selected for analysis.
Example: In a study of hip replacements, the population is all individuals who received ceramic hips, while the sample is the 143 individuals studied between 2003 and 2005.
Data and Context
Data are collections of numbers, characters, images, or other items that provide information. The context of data is described by the five W’s: Who, What, When, Where, and Why.
Who: The subjects or objects measured.
What: The variables measured.
When: The time period of the study.
Where: The location of the study.
Why: The purpose of the study.
Example: In a study of people walking blindfolded on a football field, the five W’s include the individuals tested, the variables recorded (sex, height, handedness, etc.), the location (football field), and the purpose (to see if people walk in circles).
Variables and Types of Data
Definition of Variables
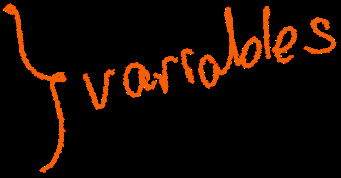
A variable is any characteristic whose value may change from one individual to another. Data are obtained by observing one or more variables.
Example: In a study of Florida lakes, variables include pH, chlorophyll concentration, average mercury in fish, number of fish sampled, and age of data.
Categorical vs. Quantitative Variables
Variables can be classified as categorical or quantitative, depending on the nature of their values.
Categorical (Qualitative) Variable: Individual observations are categorical responses. Examples include zip codes, brands, or types of gas.
Quantitative (Numeric) Variable: Observations are numbers where it makes sense to take averages. Examples include age, weight, or number of items purchased.


Example:
Weight (in ounces) of a bag of potato chips: Quantitative
Number of items purchased: Quantitative
Brand of cola purchased: Categorical
Amount of gas purchased: Quantitative
Type of gas purchased: Categorical
Identifying Variables in Data Sets
When analyzing a data set, it is important to identify which variables are categorical and which are quantitative.
Example: In a study of project completion times, variables such as education, communication, and workload are categorical, while experience (in years) and days to complete are quantitative.
Describing Data Sets
Univariate and Multivariate Data
Data sets can be univariate (one variable) or multivariate (multiple variables).
Univariate: Only one variable is measured for each individual.
Multivariate: Two or more variables are measured for each individual.
Tabular Data Example
The following table shows a sample of data collected from Florida lakes, illustrating multiple variables measured for each lake.
pH | Chlorophyll (mg/l) | Avg. Mercury in Fish (ppm) | Number of Fish Sampled | Age of Data |
|---|---|---|---|---|
6.1 | 0.7 | 1.23 | 5 | year old |
5.1 | 3.2 | 1.33 | 7 | recent |
9.1 | 128.3 | 0.04 | 6 | recent |
6.9 | 3.5 | 0.44 | 12 | recent |
4.6 | 1.8 | 1.20 | 12 | year old |
Notation and Symbols in Statistics
Sample Proportion Notation
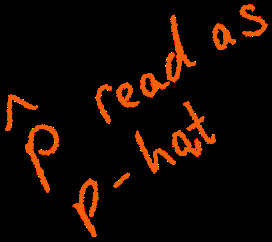
In statistics, the sample proportion is often denoted as , which is read as "p-hat." This notation is used to represent the proportion of a sample with a certain characteristic.
Approximate Equality
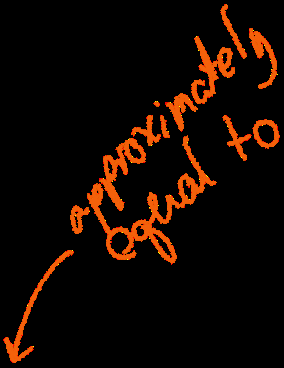
The symbol is used to indicate that two quantities are approximately equal.
Summary Table: Categorical vs. Quantitative Variables
The following table summarizes the classification of variables:
Variable | Type |
|---|---|
Weight (in ounces) | Quantitative |
Number of items purchased | Quantitative |
Brand of cola | Categorical |
Amount of gas (in gallons) | Quantitative |
Type of gas | Categorical |
Additional info: Academic context was added to clarify definitions, examples, and the classification of variables. The tables were recreated for clarity and completeness. Images were included only where directly relevant to the explanation of notation and variable classification.
