 Back
Introduction to Statistics: Foundations and Critical Thinking
Study Guide - Smart Notes
 Tailored notes based on your materials, expanded with key definitions, examples, and context.
Introduction to Statistics
Statistical and Critical Thinking
Statistics is the science of collecting, analyzing, interpreting, and presenting data to make informed decisions. Critical thinking in statistics involves not only performing calculations but also understanding the context, evaluating the reliability of data sources, and drawing meaningful conclusions.
Statistics: The science of planning studies and experiments, obtaining data, and organizing, summarizing, presenting, analyzing, and interpreting those data to draw conclusions.
Data: Collections of observations, such as measurements, genders, or survey responses.
Population: The complete collection of all measurements or data that are being considered, typically the group about which we want to draw conclusions.
Sample: A subcollection of members selected from a population, used to make inferences about the population.
Example: Residential Carbon Monoxide Detectors
Suppose there are 38 million carbon monoxide detectors in the United States. A sample of 30 detectors is tested, and 12 fail to provide an alarm in hazardous conditions. Here, the population is all 38 million detectors, and the sample is the 30 tested detectors. The goal is to use the sample to make inferences about the entire population.
The Statistical Process: Prepare, Analyze, and Conclude
The process of conducting a statistical study involves three main steps: preparing, analyzing, and concluding. Each step requires careful consideration to ensure valid and meaningful results.
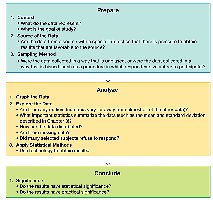
Prepare: Understand the context, identify the source of the data, and examine the sampling method.
Analyze: Graph and explore the data, apply statistical methods, and use common sense in interpretation.
Conclude: Distinguish between statistical significance and practical significance, and communicate findings clearly.
Types of Data and Sampling Methods
Understanding how data are collected is crucial for valid statistical analysis. The method of sampling can greatly affect the reliability of conclusions.
Census: Collecting data from every member of a population.
Sample: Collecting data from a subset of the population.
Voluntary Response Sample: A sample in which respondents decide for themselves whether to participate. This method is prone to bias and should be avoided for making population-wide conclusions.
Example: Voluntary Response Sample
In a television poll, viewers were asked to call in with their opinions about the location of the UN headquarters. 67% of 186,000 respondents wanted the UN moved. In a separate random survey, only 38% of 500 respondents agreed. The random sample provides more reliable results due to better sampling methodology.
Statistical and Practical Significance
It is important to distinguish between statistical significance and practical significance when interpreting results.
Statistical Significance: Achieved if the likelihood of an event occurring by chance is 5% or less. For example, getting 98 girls in 100 births is statistically significant.
Practical Significance: Even if a result is statistically significant, it may not be meaningful in practice. For example, increasing the probability of having a girl from 50% to 52% is statistically significant but not practically significant for most couples.
Example: Statistical vs. Practical Significance
Testing a product with 10,000 couples results in 5,200 girls (52%). This is statistically significant (very unlikely by chance), but the practical difference (2% increase) is minimal and may not justify the product's use.
Potential Pitfalls in Analyzing Data
Several common pitfalls can lead to misleading conclusions in statistical studies:
Misleading Conclusions: Conclusions should be clear and understandable, avoiding technical jargon.
Sample Data Reported Instead of Measured: Direct measurement is preferred over self-reported data to avoid inaccuracies.
Loaded Questions: Poorly worded survey questions can bias results.
Order of Questions: The sequence of questions can influence responses.
Nonresponse: Occurs when selected individuals do not participate, potentially biasing results.
Misleading Percentages: Percentages should be interpreted carefully; values over 100% are often unjustified.
Summary Table: Key Terms and Concepts
Term | Definition |
|---|---|
Population | The entire group of individuals or items being studied |
Sample | A subset of the population selected for analysis |
Census | Data collected from every member of the population |
Voluntary Response Sample | Sample where participants self-select to respond |
Statistical Significance | Result unlikely to occur by chance (probability ≤ 5%) |
Practical Significance | Result is meaningful or useful in real-world terms |
Additional info: These foundational concepts are essential for understanding all subsequent topics in introductory statistics, including data collection, analysis, and interpretation.
