 Back
BackIntroduction to Statistics: Foundations, Data Types, and Sampling Methods
Study Guide - Smart Notes
 Tailored notes based on your materials, expanded with key definitions, examples, and context.
Introduction to Statistics
What is Statistics?
Statistics is the science of planning studies and experiments, obtaining data, and organizing, summarizing, presenting, analyzing, and interpreting those data to draw conclusions. It is foundational for making informed decisions in health sciences, biology, and many other fields.
Data: Collections of observations, such as measurements, counts, or survey responses.
Population: The complete collection of all measurements or data being considered.
Sample: A subcollection of members selected from a population.
The Statistical Process
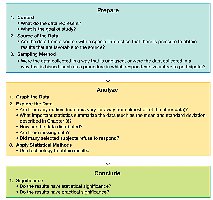
The process of conducting a statistical study consists of three main steps: prepare, analyze, and conclude.
Prepare: Define the context, identify the source of data, and determine the sampling method.
Analyze: Graph and explore the data, apply statistical methods, and use common sense in interpretation.
Conclude: Draw conclusions, considering statistical significance.
Statistical and Critical Thinking
Importance of Critical Thinking
Critical thinking is essential in statistics to ensure that conclusions are valid and based on sound data collection and analysis methods. The quality of the data and the appropriateness of the statistical methods directly affect the reliability of the results.
Types of Data
Quantitative vs. Categorical Data
Quantitative (Numerical) Data: Consists of numbers representing counts or measurements. Examples: Weights of individuals, ages, number of siblings.
Categorical (Qualitative) Data: Consists of names or labels that are not numbers representing counts or measurements. Examples: Gender, shirt numbers on uniforms (as identifiers, not quantities).


Discrete vs. Continuous Data
Discrete Data: Quantitative data where the number of possible values is finite or countable. Example: Number of coin tosses before getting tails.
Continuous Data: Quantitative data with infinitely many possible values, not countable. Example: Lengths measured from 0 cm to 12 cm.
Levels of Measurement
Four Levels of Measurement
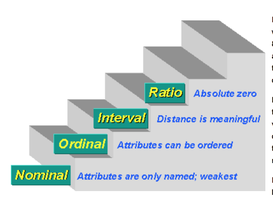
Data can be classified into four levels of measurement, each with increasing complexity and mathematical meaning:
Nominal: Categories only; no order or ranking. Example: Types of energy drinks.
Ordinal: Categories with a meaningful order, but differences between values are not meaningful. Example: Course grades (A, B, C, D, F).
Interval: Ordered categories with meaningful differences, but no true zero point. Example: Years (e.g., 1000, 2000).
Ratio: Ordered, meaningful differences, and a true zero point; ratios are meaningful. Example: Class times (50 minutes, 100 minutes).

Parameters and Statistics
Definitions
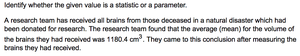
Parameter: A numerical measurement describing some characteristic of a population.
Statistic: A numerical measurement describing some characteristic of a sample.
Example: If a research team measures the average volume of all brains received from a natural disaster, the mean is a statistic if it describes only the sample measured, not the entire population.

Collecting Sample Data
Sampling Methods
The method used to collect sample data greatly influences the quality of statistical analysis. The most important sampling method is the simple random sample, but other methods are also used depending on the study design.
Simple Random Sample: Every possible sample of the same size has the same chance of being chosen.
Systematic Sampling: Select a starting point and then every kth element in the population.
Convenience Sampling: Use data that are easy to obtain, but may not be representative.
Stratified Sampling: Subdivide the population into subgroups (strata) and sample from each.
Cluster Sampling: Divide the population into clusters, randomly select clusters, and include all members from selected clusters.
Multistage Sampling: Combine several sampling methods in stages.
Types of Studies
Observational Study: Observing and measuring characteristics without influencing the subjects.
Experiment: Apply a treatment and observe its effects on subjects (experimental units).
Types of Observational Studies
Cross-sectional Study: Data collected at one point in time.
Retrospective (Case-Control) Study: Data collected from past records.
Prospective (Cohort) Study: Data collected in the future from groups sharing common factors.
Design of Experiments
Key Concepts
Replication: Repeating an experiment on multiple individuals to ensure reliability.
Blinding: Subjects do not know whether they receive treatment or placebo, reducing bias.
Double-Blind: Both subjects and experimenters do not know who receives treatment or placebo.
Randomization: Assigning subjects to groups by chance to create comparable groups.
Confounding
Confounding occurs when the effects of different factors cannot be distinguished from each other. Proper experimental design aims to minimize confounding variables.
Statistical Significance
Definition
Statistical significance is achieved if the likelihood of an observed event occurring by chance is 5% or less. For example, getting 98 girls in 100 random births is statistically significant, while 52 girls in 100 is not.
Summary Table: Levels of Measurement
Level | Description | Example |
|---|---|---|
Nominal | Categories only | Types of energy drinks |
Ordinal | Categories with order | Course grades |
Interval | Order and meaningful differences, no true zero | Years |
Ratio | Order, meaningful differences, true zero | Class times |
